This is a post (what is now 2 posts) has been half written the last couple of months because it is scary. As a white male with lots of privilege, these are the hard conversations. The following piece begins by digging into the basic data, while the second part digs in on some of the implications of that information. As with all data, it speaks in generalities not to individual experiences and obviously racial groups are not monoliths, with the experience of various neighbourhoods or communities varying widely.
The Data
Before we dig into this discussion, we have to talk about what data is readily available. To be frank, there isn’t a lot. Despite the debate around tracking race-based COVID data has occurred, it currently isn’t being tracked formally or locally. Statistics Canada until just this week (Thursday June 11) that will add racial data to the Labour Force Survey, prior to this it only really collected data on race in the Census.
Locally there are major gaps as well. At June 2 meeting of the Greater Essex County District School, a question was asked about racialized data tracking with the response from administration being utterly disappointing. Simply put the GECDSB doesn’t track racialized data and they may not until mandated in 2022. I assume that the Catholic and French Boards are on a similar timeline and even when they are collecting the data, it doesn’t mean it will be made public due to the competitive nature of the school boards overriding the public good.” Standardized testings in the form of EQAO does not report on racialized data with data collected on ESL and newcomers student populations which likely are racialized but not confirmed. Racialized data is something that Legal Aid Ontario thinks School Boards and other organizations should be tracking.
The Landlord Tenant Board doesn’t track evictions let alone racialized data; our local community housing provider has nothing public on their website while some municipal data, like the Point in Time Count does included ethnicity questions. I could not find anything on Windsor Police website with the majority of crime data from a research standpoint being housed in a largely inaccessible map .
The Vital Signs survey, carried out by the Windsor-Essex Community Foundation is the largest annual general data collection in our region (not without flaws) does not ask any questions about racial/ethnic background. The closest they get is inquiring about whether or not you were born in Canada.
The Health Unit has a number of published reports with some touching on race but this is largely be driven by the kind of research that is being undertaken. If primary research with local data collection in some cases they do collect racialized data, but many regional or provincial datasets miss this.
Workforce WindsorEssex has put out some racialized data but due to the constraints of their data sources: Labour Force Survey, Taxflier or other Statistics Canada data sets, their ability to drill down is constrained. Finally my own organization has to date largely not applied a race based lens to our published work. That’s on me, and that will change but the biggest challenge will be getting that data.
Where does that leave us? Well it leaves us with Statistics Canada data from the Census. The bulk of the data utilized in this post (and next) comes from the 2016 Census with few other data sets that speak to the CMA or regional data sets. As a result, I a number of inferences from those data sets by meshing the together with other data. These inferences should not be scene as causal or 100% accurate but rather points of interest that require additional exploration.
Before I move forward, I will point out a couple of skewed Dissemination Areas in the census data when you map it. When talking about subsets of populations it is best to have relatively stable samples in a particular geographic area. Most Census DA have between 500-700 people in them with the rule of thumb being that when an area reaches double that size it gets split into two areas. Usually this split occurs on geographic or political lines to avoiding spillovers into other DAs and keeping samples consistent census to census.
Unfortunately there were 9 DAs at the time of the 2016 Census that had more the 2000 people in them, with the largest having over 7,000 people residing in that area. For the purposes of mapping smaller population subsets, this create challenges in scale creation and representing the population proportion. This could mean that there may be 500 people living in an area only representing 10% of the population while in a neighbouring area there are 50 people representing the same percentage. When summing total populations these areas will always be the largest just due to their scale.
When looking at Windsor, areas in East Windsor, between Lauzon and Banwell, North of the VIA Rail tracks; in the South Cameron and Division area of Ward 10; Devonshire Heights in Ward 9, are all home to oversized DA. In the County, North of CR 42 in Belle River are two DA that are oversized and in Kingsville there is a large area north of the town that also is in need of dividing. What is common to these areas was that between 2011 and 2016 Censuses, there was significant population growth in these areas and as Census boundary being redrawn was skipped in 2016 this will hopefully be corrected in the 2021 Census.
Where do people of colour live in Essex County?
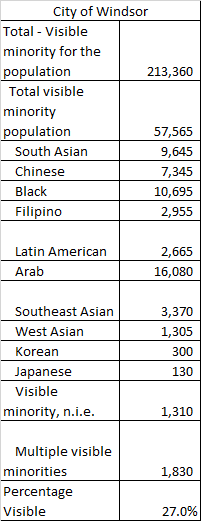
Approximately 18% of Essex County’s population identifies as being a visible minority at the time of the 2016 Census. This represents approximately 70,720 individuals. The Windsor CMA and the City of Windsor are both home to the majority of this population with 66,480 (20.5% of total population) and 57,605 (26.9%) respectively. When broken down by identified by race we find:
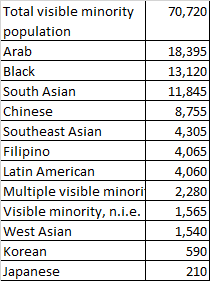
The population groups outline above are defined by Statistics Canada based on being the largest national groups. In some cases, for groups like Japanese or Korean they are specific ethno-national backgrounds while others are amalgamations of numerous nationalities or cultures. Visible Minorities n.i.e are “not included elsewhere” are written in responses on the census identifying specific sub-groups like Oceanian or Indigenous who are not captured in the categorization outlined above. When we breakdown population totals by specific municipalities:
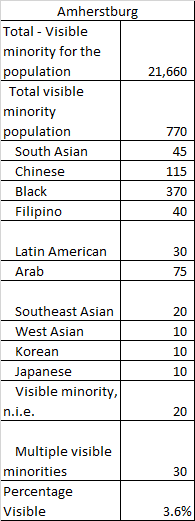
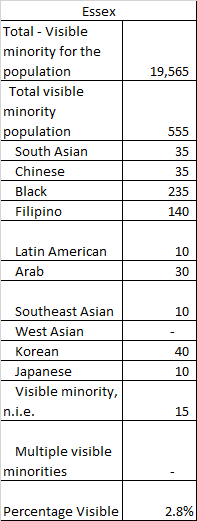
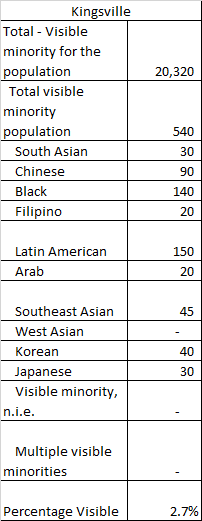
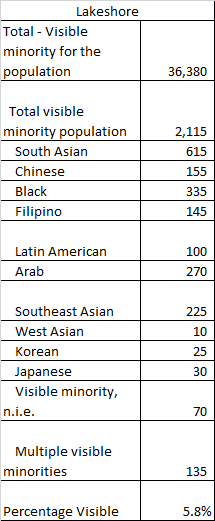
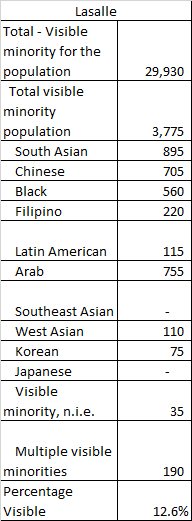
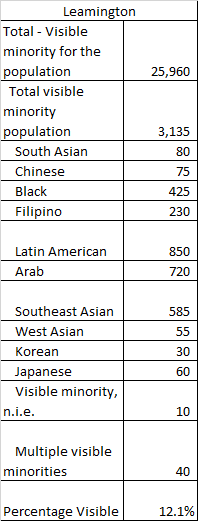
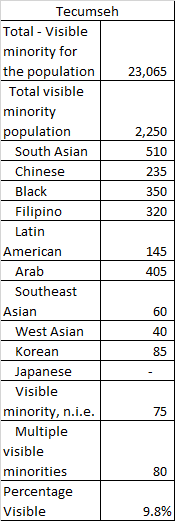
You can clearly see despite the debate/discussion of how diverse the region is, it really only certain communities (and parts of certain communities) are truly diverse. Obviously this was a snapshot in time, and populations have continued to grow but this is the foundation on which that growth occurred. The proportion of visible population varies with approximately 1 in 4 in the City of Windsor identifying as a visible minority to 1 in 50 in Kingsville. Within the City of Windsor, it breaks down like this:
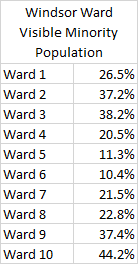
What we find is that Wards 5 and 6 have less than half the diversity of the City as a whole; while Ward 10 could be on the verge of becoming the first Ward where white people not make up the majority of the population. This transition will likely still take until the mid-2020s to occur.
The map below shows the proportion of population that identifies as a visible minority in each Census Dissemination Area. Areas shaded in grey have no individuals who identified as a visible minority residing in that area.
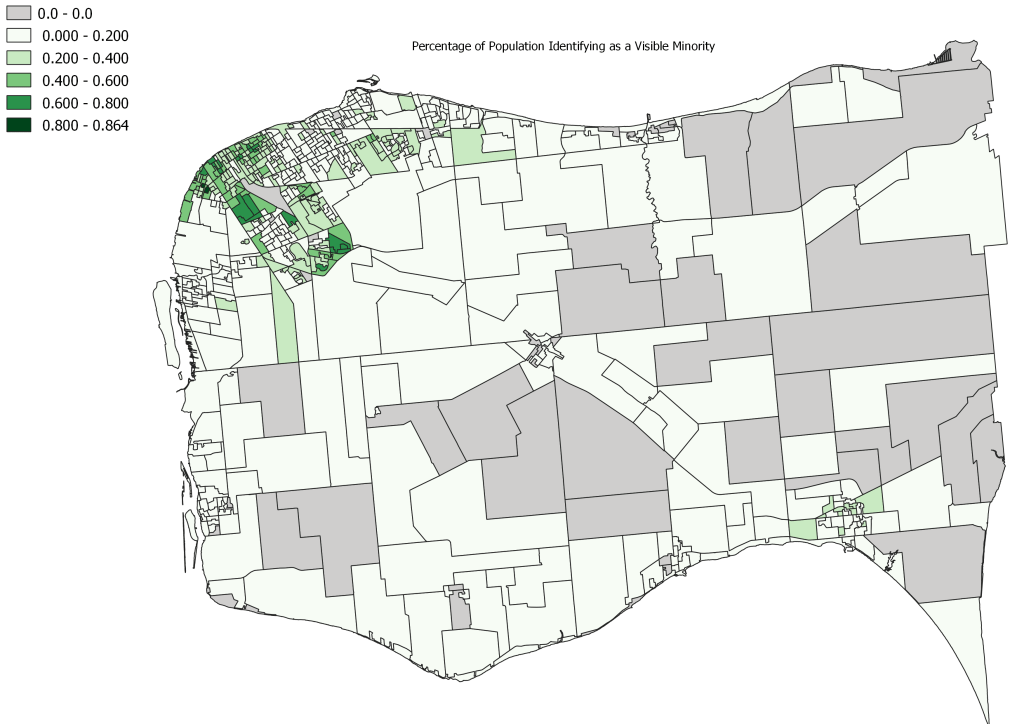
What is important to consider is that the lightest shades on the maps are in many cases home to only a handful of households as well. For the bulk of Essex County a handful of persons of colour may be the only individuals residing in a particular DA leading to the perspective of a relatively homogeneous communities. The greatest concentrations are found in Windsor with the darkest shades in areas like South Cameron and Division being some of the largest community (based on total population) while Downtown and West Windsor emerge as do area like Walker Gates as some most ethnically diverse (proportionally) in our region.
Break Out by Race
In the gallery below you see each of the visible minority total populations mapped. Unlike the map above this shows the total populations, but as above, grey on the map represents 0 individuals identified with that population. Note that the East Windsor and Division/South Cameron areas do skew the upper end of the data due to their larger population sizes. Think of those ares on the map being divided into 5 to 10 sub-DA after 2021 Census.
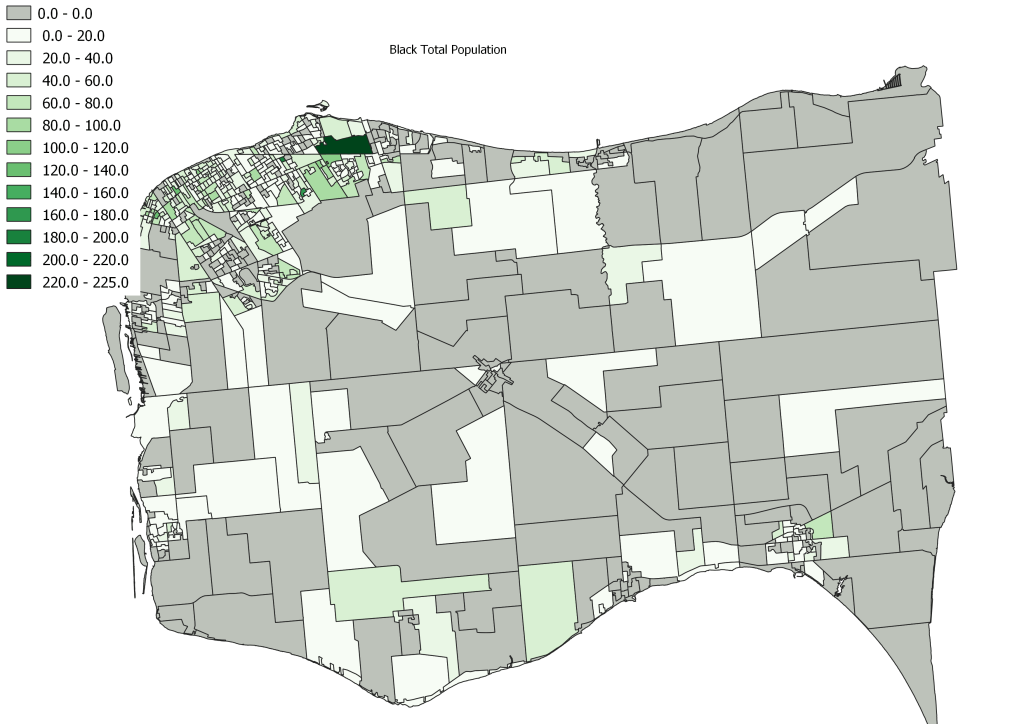
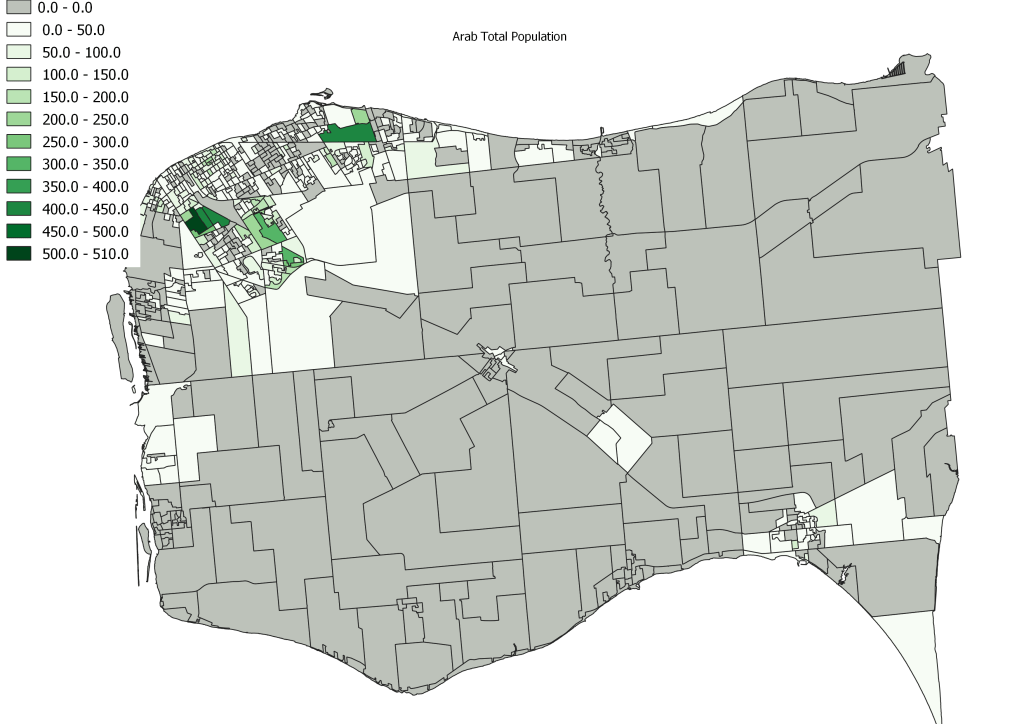
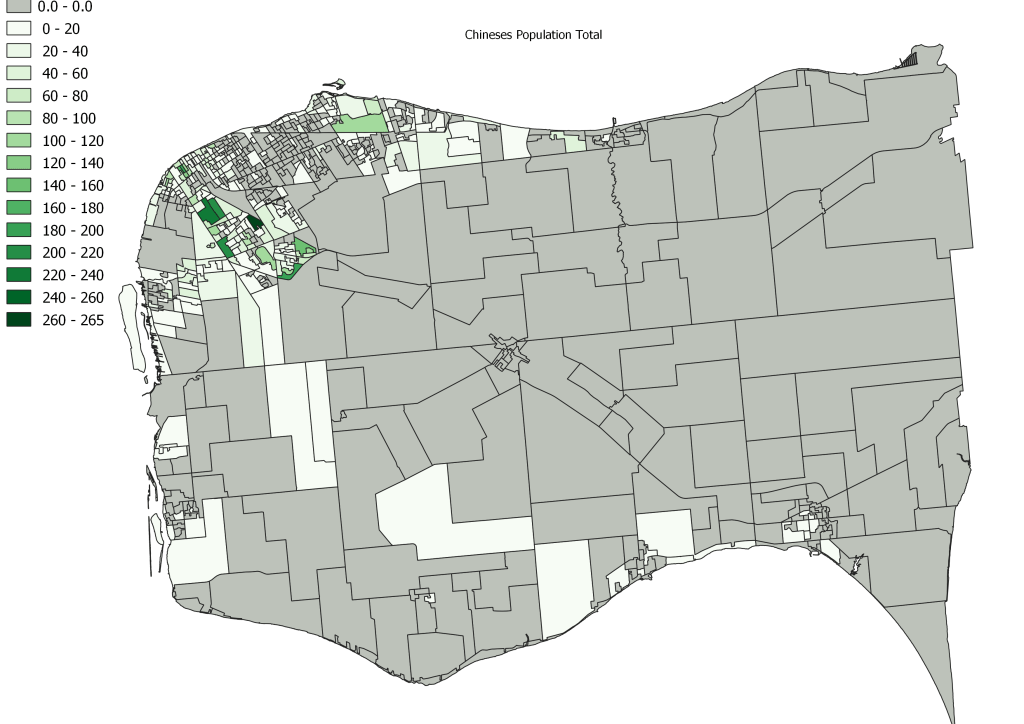
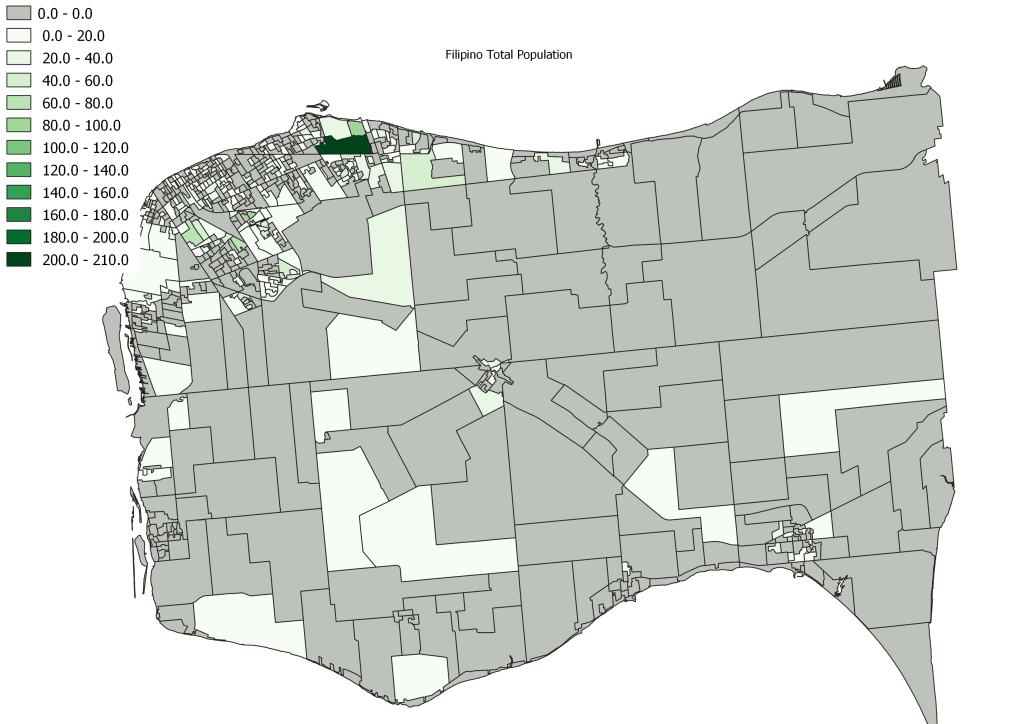
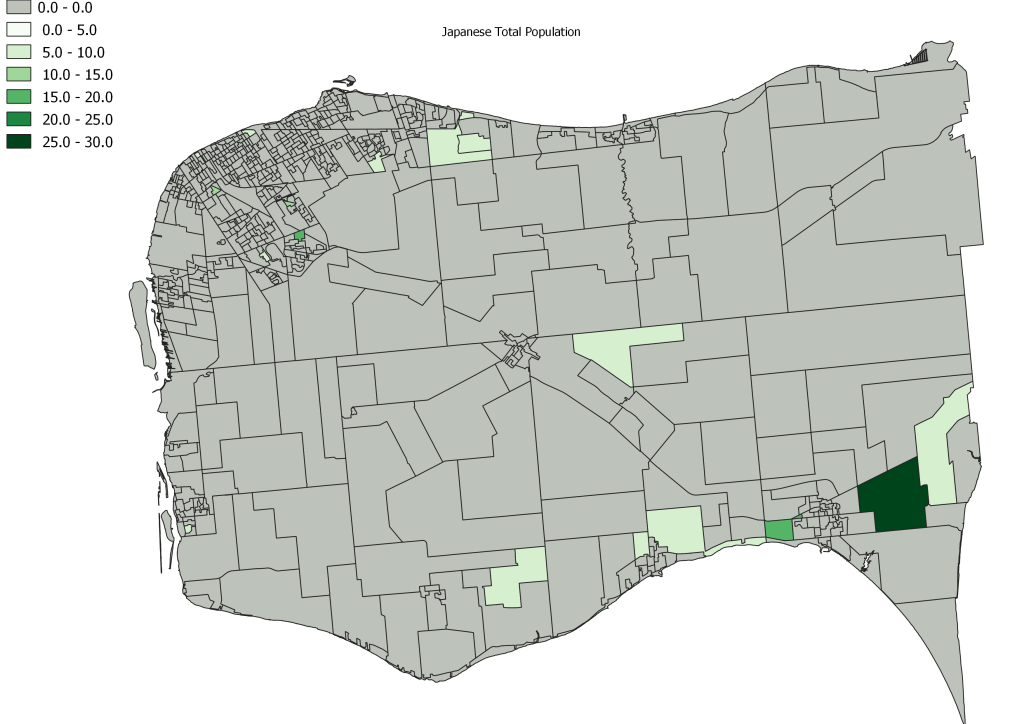
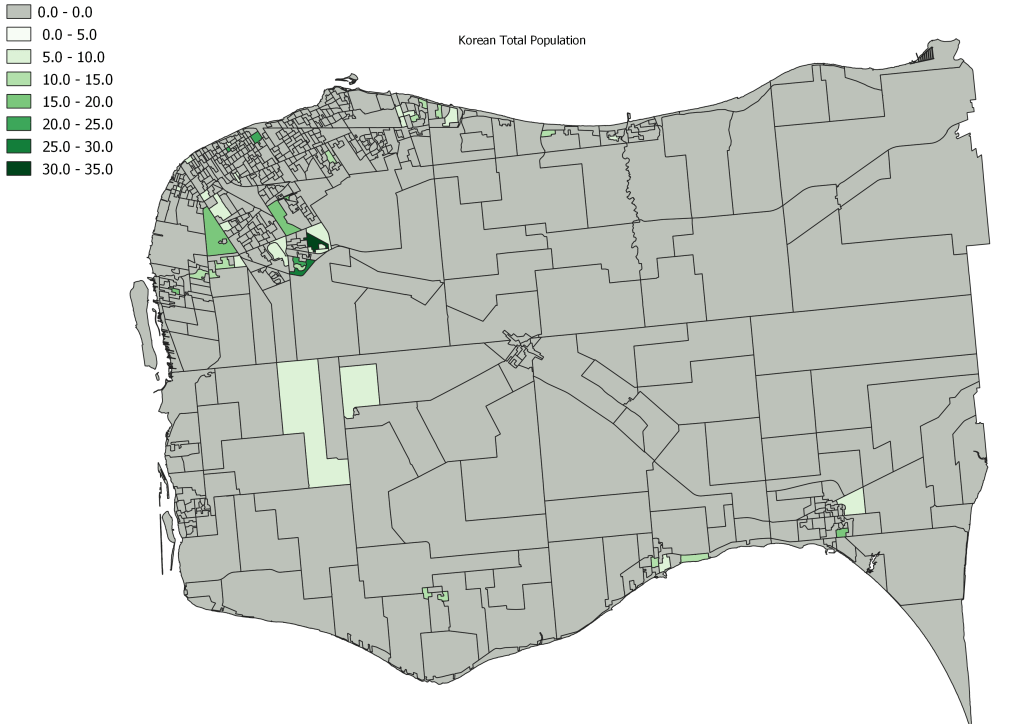
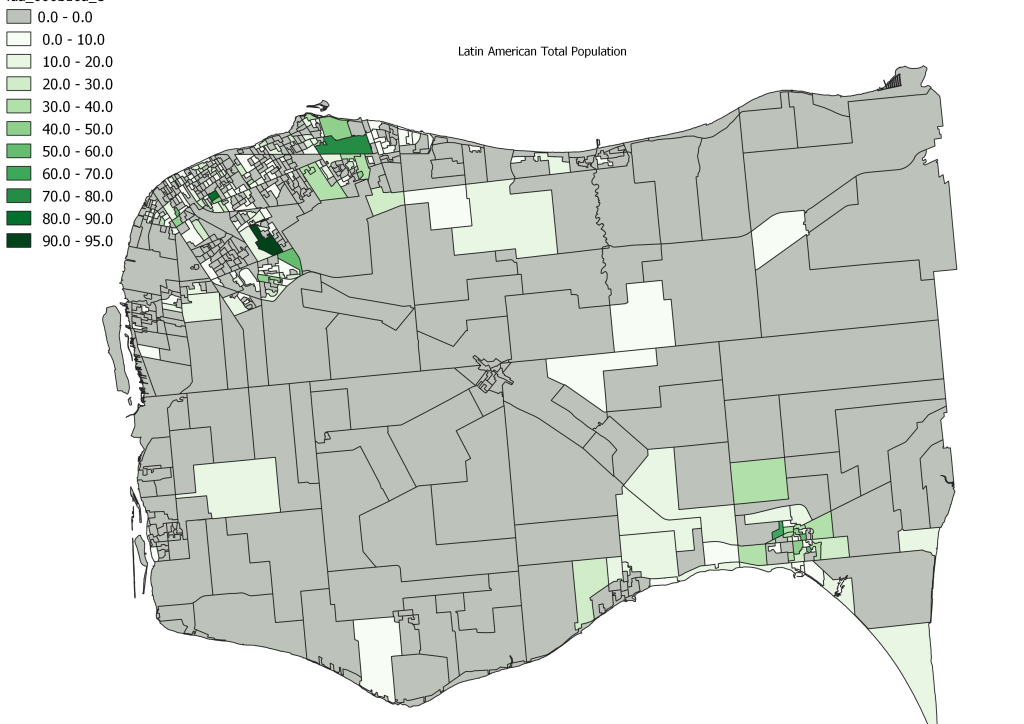
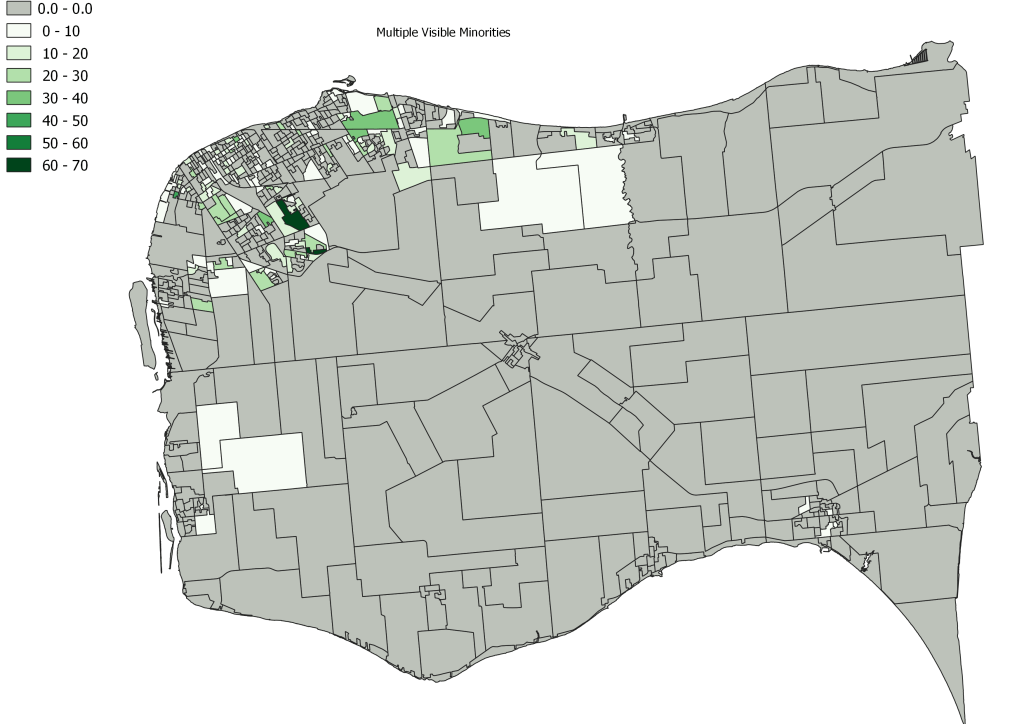
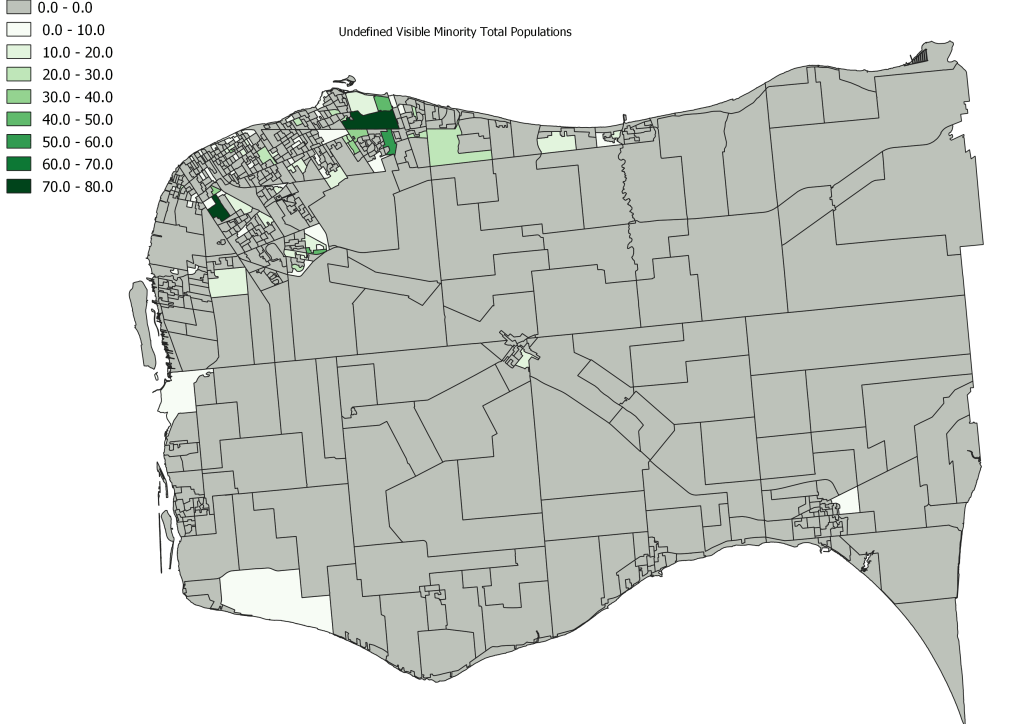


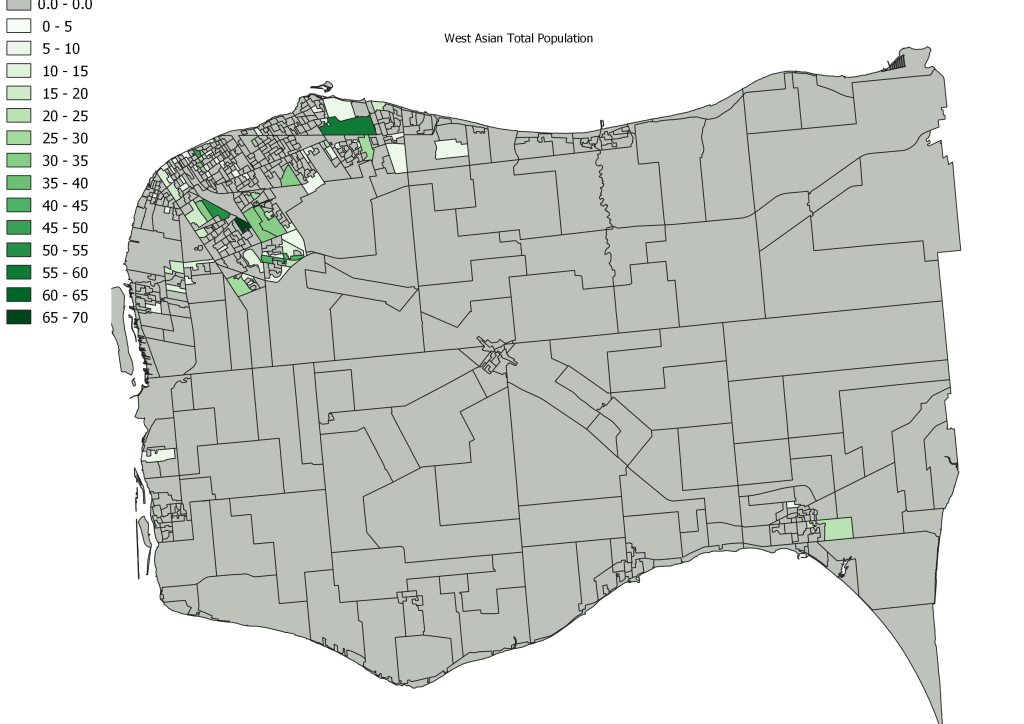
I am not going to dig into the specifics of each map. I will note that the scales do change map to map, as in some cases like with the Korean population 35 people are the largest group in a specific DA in Essex County, compared to 650 South Asians living in a single DA. I will leave that for readers to work through and explore but I highlight a few things:
- The bulk of Essex County has very little diversity. Many of the white shaded areas on these maps see only a handful of households in those areas. The implications of this are that for many people despite it being 2020, they see very little diversity in their day to day life.
- We are fortunate, unlike Toronto, where there are clearly defined racialized communities, areas where visible minorities reside in Essex County tend to multi-ethnic particularly the large Census DAs outlined above.
- The three largest population groups: Arab, Black and South Asian drive most population statistics.
- That being said the mapping does show that certain population do cluster in certain areas where there is less opportunity.
Part two of this blog will dig into some of the inequality faced by these racialized populations looking at specific correlations and indicators.

Pingback: Windsor Research Project: Racial Inequality | gingerpolitics
Pingback: Windsor Research Project: Indigenous Populations | gingerpolitics
Pingback: A Few Thoughts on Week 23 | gingerpolitics
Pingback: A Few Thoughts on Week 48 | gingerpolitics
Pingback: A Few Thoughts on Week 65 | gingerpolitics
Pingback: A Few Thoughts on Week 67 | gingerpolitics
Pingback: Census 2021: Visible Minority Populations and Immigration Status, Education, Employment and Journey to Work. | gingerpolitics