Welcome to the second post in the Windsor Research Project on Racial Inequality in Windsor-Essex County. You can review the general data on racialized populations in Part 1.
This post digs in a bit, and uses Statistic Canada data to draw some general correlations on our region. The points outlined below are general in nature, not speaking to specific life experiences or even the entire experience of an organization, neighbourhood or community. Some of the correlations are spurious or themselves related to one another (ex. low income neighbourhood having poor educational attainment are highly related, regardless of race) but that fact when applied across a number of radicalized groups does still provide insights.
I share the data and the correlations because there are common themes and patterns that I find concerning.
Digging back in
As Arab, Black and South Asian communities represent almost 2/3 of all visible minorities population in Essex County. Their population drive most representation in our region.
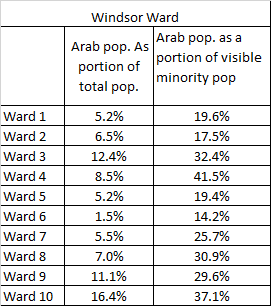
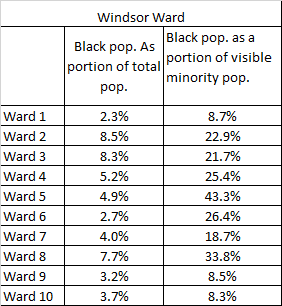
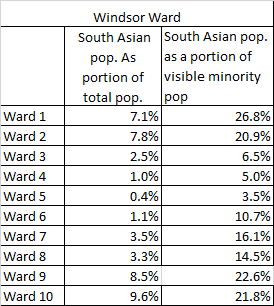
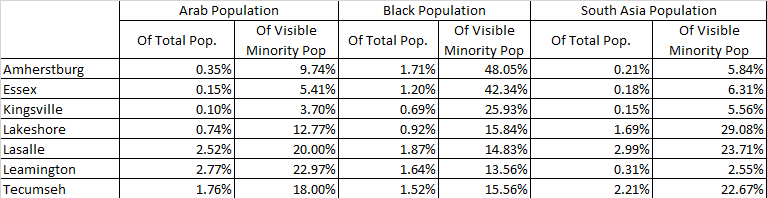
What I find interesting knowing what we know about socio-economics of parts of our city/region. First for Arab populations you see distinct groups in certain communities when you dig into nationalistic data. Syrians and Iraq’s near the downtown core in Ward 3 while what I would image are more established Lebanese and Pakistani communities in Wards 9 and 10. This is a little less clear in the South Asia population where the College & University are likely drivers in Ward 1 & 2 (although the boom in international students hadn’t fully started in 2016). At the same time you see more South Asians in LaSalle, Tecumseh and Lakeshore in more affluent suburban communities. Meanwhile the Black population is more evenly disbursed across the City and County with their concentrations being in parts of the region where there are known socio-economic challenges. Wards 5 and 6 are bastions of whiteness in the City while Amherstburg, Essex and Kingsville were home to only a handful of families from these groups at the time of the census.
What we are not talking about are monoliths. Where these communities have clustered has largely been due to their economic mobility. What I would love to have is longitudinal data to unpack newcomer vs historical legacy effects. How does a immigrant from the 1970s fair to one today, vs a black family that has been hear 100+ years. We can guess, and assume but we don’t know for sure.
Correlations
So the question on everyone’s mind is what does racial inequality look like in Essex County? Without accessing specific and specialized racial data sets it is a challenge but one way that it can be explored is through correlation analysis.
Correlations are scored on a -1 to +1 and as the statistic gets closer to these values, a more perfect relationship is identified. A perfect relationship would mean for every increase in X variable, Y variable increases an equal amount. Generally speaking, I would argue that if a value is greater that +/-0.3 that something is going on. Now a +/-0.3 score is not definitive proof relationship but just a point that needs to be explored further, when scores rise closer to +/-0.5 then relationships can begin to be assessed. The table below, highlights all correlations greater that 0.3 (red) and -0.3 (green)
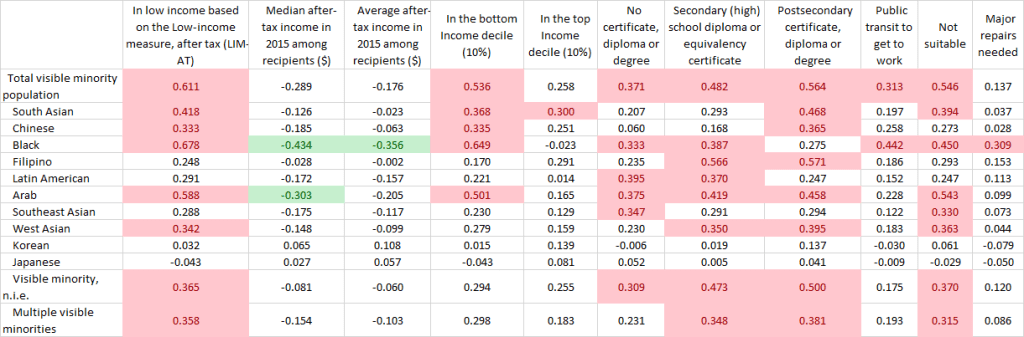
When we breakout specific racialized groups we see a number of concerning trends. Black populations have a correlational with 8 of 10 categories with the two categories that are not significant are earning the top decile (Top 10% of incomes) as a slightly negative value and post secondary attainment. Black populations were also the only group that had a significance in using public transit to reach work, which could mean they were possibly disproportionately impacted by the COVID Transit shutdown in our region.
For almost all racialized groups except the smaller Japanese and Korean populations, median and average incomes are negatively correlated although not necessarily at a significant level.
But what about white people you ask?

[Author Update: In completing the piece on Indigenous Populations to follow this one I found that the original labeling on this table that stated white populations, was not totally accurate as non-visible minorities (which the data category is called) does include non-white populations like aboriginal or other groups who do not fit the Employment Equity Act categorizations. The chart above has been re-labeled but no other changes to the piece have occurred as the correlations and outcomes illustrated in the data are largely driven by white people.]
There is no way to cut it, being white in Essex County means you have significantly fewer barriers than most persons of colour. White people have the highest correlation with the top income decile (10%) at 0.649. It also shows the highest correlation with high school completion and post-secondary completion (any form); less likely to be in low income and the marginal negative value for being in bottom income decile points to white households.
School Success?
In the US, racialized populations are strongly related with school success (or lack thereof). Student success is also tied to a number of factors like low income, lack of father figures, food insecurity etc. etc. The above correlations if they hold completely true should show some relationship between where visible minorities are living and which schools preform poorly on standardized testing.
To be fair to school boards the Ontario school system is not like the US system but I was curious to see if where poor performing schools are located was there some association with the visible minority population? Unfortunately, the school boards (all local) do not publicly release the boundary files for each school. You can look up the school catchments on their transportation consortium website but nothing that allows researchers to explore the nuances of a particular school community socio-economic or demographic make up.
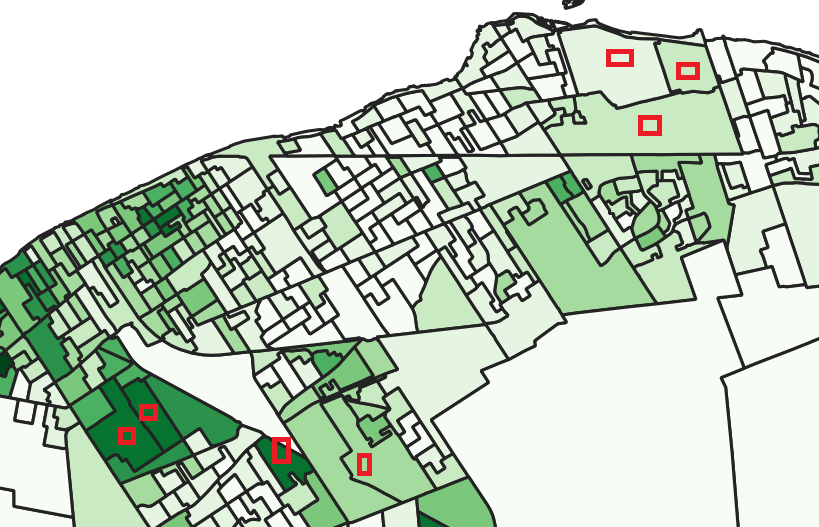
The maps below, show the 5 lowest scoring schools (across all boards) on EQAO testing for Grade 3 (reading, writing and math combined average) and Grade 10 Ontario Literacy Test averaged over 3 years.
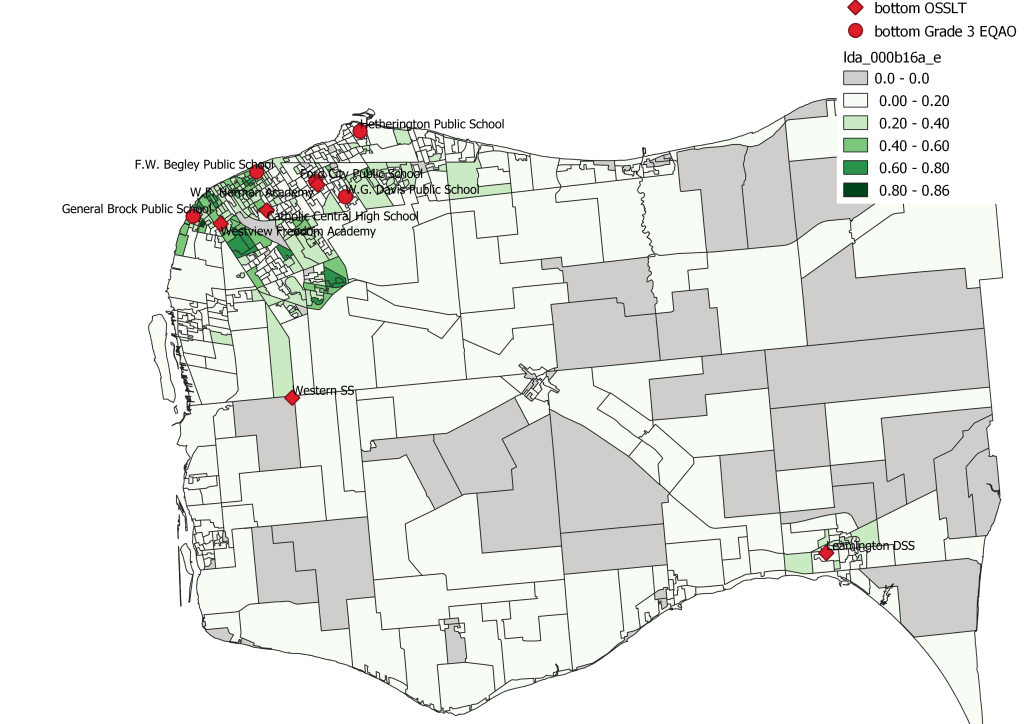
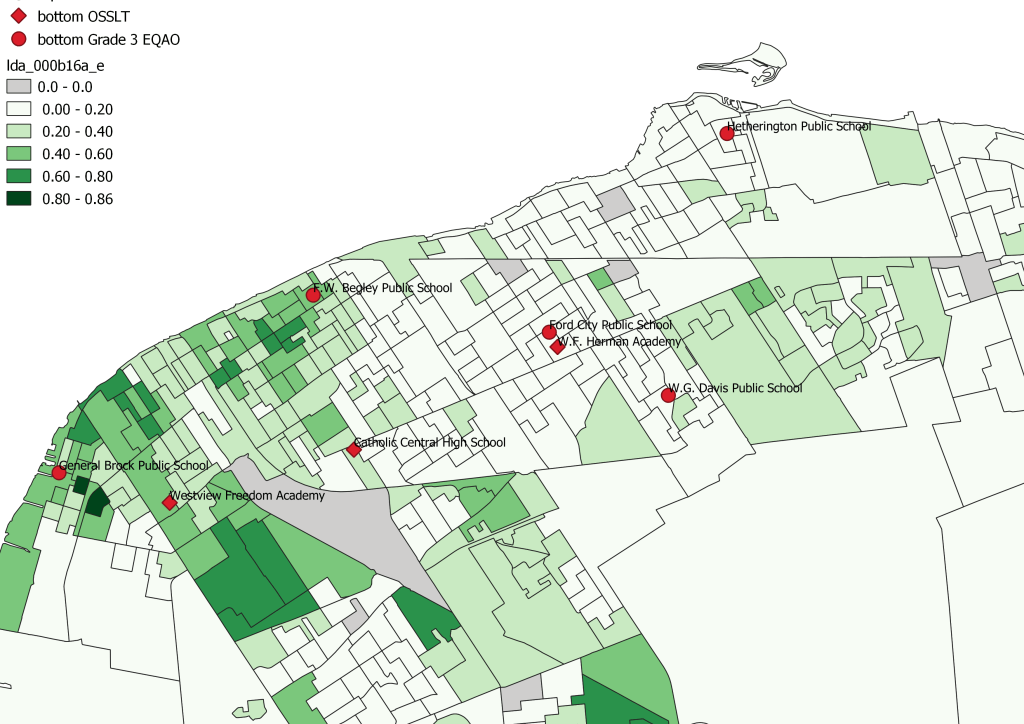
The relationship isn’t nearly as clear between school outcomes and race. Give the varying sizes of school catchments and overlapping school districts it is difficult to say if the kids in a neighbourhood actual go to their neighbourhood school. That being said, the schools with some of the lowest test scores do have catchments that pull from some of the most racially diverse communities in Windsor. Based on the correlations above, it is likely that Black kids might be more at risk than a white kid out of the same neighbourhood.
Brock, Beagley and Ford City schools pull from communities with high low income rates communities, while Davis Public School has a small catchment that includes a significant community housing community. The high schools, Westview, Catholic Central, Leamington District and Herman all pull students from similar socio-economic areas.
Two primary outliers are Western Secondary and Hetherington Public School. In the case of Hetherington, it does pull from the dissemination areas that are over sized in East Windsor so despite the lower percentage of visible minorities, the total number of the catchment is inflated. Western Secondary, pulls from almost half the county and it’s poor literacy test scores are tough to tie to racialized populations given the lack of diversity in those communities.
Housing
Speaking of social housing although I wasn’t able to find data on WECHC resident make-up we can look at where their communities are located in the context the visible minority population data.
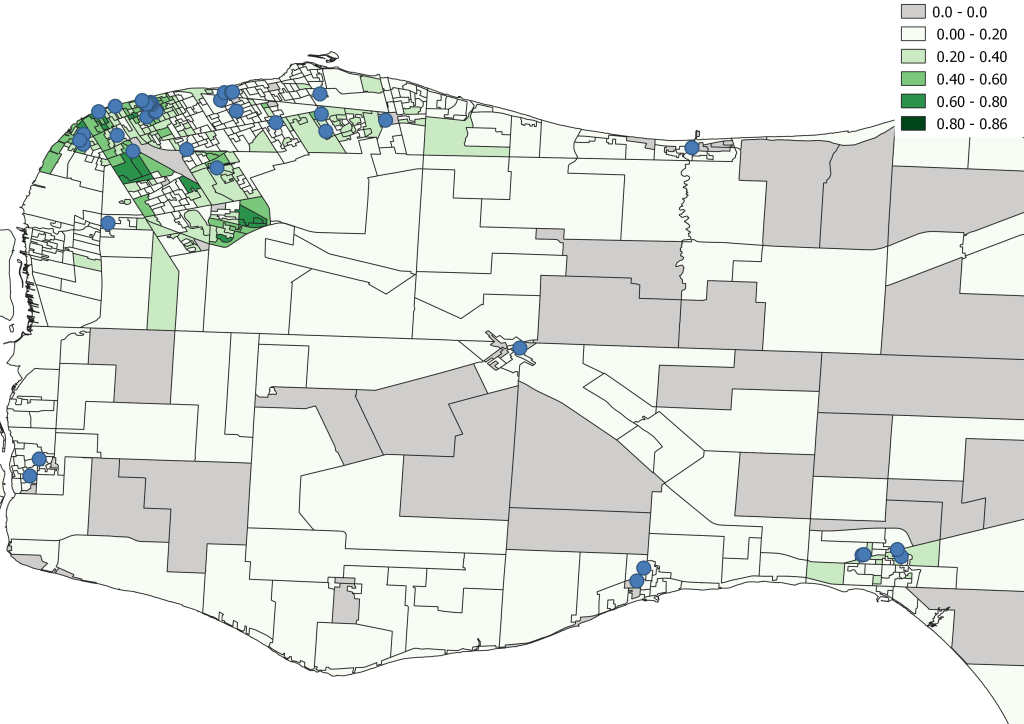

Generally speaking portion of population of visible minorities are higher in DAs with WECHC buildings present. To be fair, this doesn’t mean that they live in those buildings and this mapping does not include other non-profit or social housing providers but the correlation is at a surface level looking pretty strong.
Looking above the largest portion of Black populations are found in Wards 2, 3 and 8 which are also home to the some of the largest portions of WECHC Communities. As WECHC begins it’s regeneration plan (I couldn’t find the full plan, link is a brief) it should think about a racial lens and how do we diversify those communities and ensure that vulnerable communities aren’t displaced.
Leadership
Does the leadership of our institutions and organizations reflect our community? Short answer, no. Part of this is a legacy of past decisions, diversity hasn’t been actively attempted so it largely hasn’t occurred. So I did what any person who was interested in joining a Board of Directors would do, go onto the website of the organization and look who is on the board currently. If there were photos available I used those photos to estimate the boards’ diversity. This isn’t 100% accurate as I can’t say how someone identifies themselves but if an organization is trying to represent diversity and you can’t see it on their website, how diverse are they?
Please note that I did not include the organizational leadership staff position if listed.
There are lots of reasons why a person is recruited to a Board of Directors. They are brought on for specific skills or talents, some for their connections, others for the organizations that they work for. I can’t speak for the specific processes that led to the boards looking the way that they do, but the numbers speak for themselves. If organizations can’t get to gender equity what shot is there for racial equity? Even to meet the low standard of the regional average of approximately 20% of board members representing racialized populations, it means that white people have to get out of their way. That being said, if you call yourself a leading organization, hitting the minimum standard in my opinion isn’t good enough.
As has been debated many times in the community, including on my blog around the challenges faced by women in our community. Board positions are catapults for politically ambitious people, it is where they make connections, meet mentors and create relationships that can help a person run for office successfully. So it is no wonder that our local political representation is so abysmal when the training ground is so white male dominated.
Media
Beyond the boardrooms, our media also doesn’t look a lot our community either. Looking at the Windsor Star and CTV Windsor both newsrooms have distinct lack of diversity, while the CBC Windsor is better (I couldn’t find an updated list of their reporters all that was online was this list from 5+ years ago with several people no longer with the station). These are the people who shape narratives in our community, the lived experiences they have shape the questions they ask. I recognize the challenges that local media face, but the questions they do and in many cases more importantly don’t ask shape our community. They work hard and I am by no mean implying that they are biased, but is existing make up of our newsrooms what is best for our community? Are true diverse stories being told?
When national newsrooms revolt over racially charged op-eds, I wonder if something similar happened when what I would call an at best; grossly mis-informed and ill timed and at worst border line racist op-eds disappeared off the Windsor Star website. No retraction, no apology, just silently burying the misdeed, as is the Windsor way.
Where do we stand?
I will be honest, this is somewhat overwhelming even for me. Having unpacked this data, where does it lead? I have no idea. The realist in me says that 6 months from now, a lot won’t have changed as organizations will be going through “processes” to figure out how to diversify. Bold action isn’t Windsor’s way.
The question for some is whether or not the incremental pace of change of institutions will be fast enough? Will delegates show up at budget time to #defundthepolice or will a cold winter night in a post virus world keep them home? Will #blackedout social media translate to action in our community? Personally I am not optimistic.
I say that because, we have problem, our region has become diversely segregated. How many leaders in our community, on the Board of Directors listed above actively live in diverse parts of our community? How many see the poverty or challenges of our community, on a regular basis outside of their work setting? The growth of the suburban communities has been driven by people moving out of the city, we can add another layer to that, white flight.
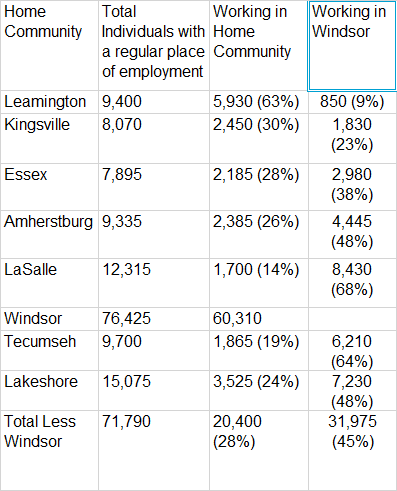
Whether police officers, professors, doctors, teachers, they don’t live in the community they work. Every morning more than half of Tecumseh’s and LaSalle’s population jumps in a car and drives into Windsor to work. There is nothing wrong with that, but it enables them to “other” parts of our region. At the end of the day, most leave Windsor and its problems behind and return to a safe, secluded and cloistered community. If we truly want change, breaking the systems of structural racism, it will take white people living in the suburbs to give something up.
Until we are ready to have that conversation, nothing is really going to change.

Pingback: Windsor Research Project: Racial Data | gingerpolitics
Pingback: Windsor Research Project: Indigenous Populations | gingerpolitics
Pingback: A Few Thoughts on Week 23 | gingerpolitics
Pingback: A Few Thoughts on Week 48 | gingerpolitics
Pingback: A Few Thoughts on Week 65 | gingerpolitics
Pingback: A Few Thoughts on Week 67 | gingerpolitics
Pingback: Census 2021: Visible Minority Populations and Immigration Status, Education, Employment and Journey to Work. | gingerpolitics