The following is Census data about the City Wards of Windsor. This data is estimated based on the Census DA that make up the being assigned to the specific wards. This assignment is not perfect in that some DAs straddle ward boundaries by a few blocks. I try to even out these straddling points as best I can. If you want to see where things were in 2016 you can find it at my old Know Your Ward post.
Also due to Statistics Canada rounding a number of datasets to the nearest 5th person (0 or 5) some of the percentages do not add to 100%.
I am happy to answer any question on this data and what it means but if I get one from a candidate for council I will post the question and response in this post.
Updates
- Tweaked language on Female+ led lone parent family number to make it more clear.
- October 2 update added language, indigenous and housing data
- Updated with final census data sets including immgration, employment, work from home, mode of transport
Know Your Ward
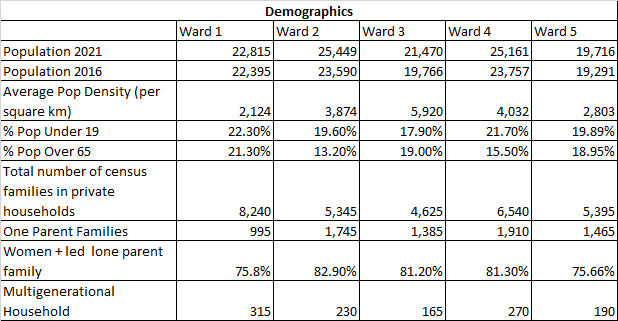
Demographics

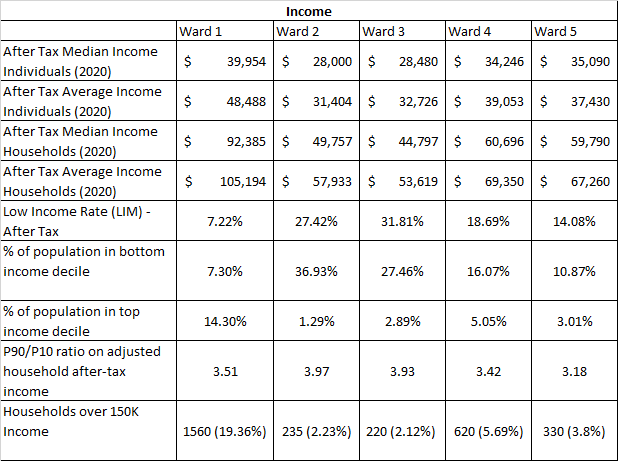
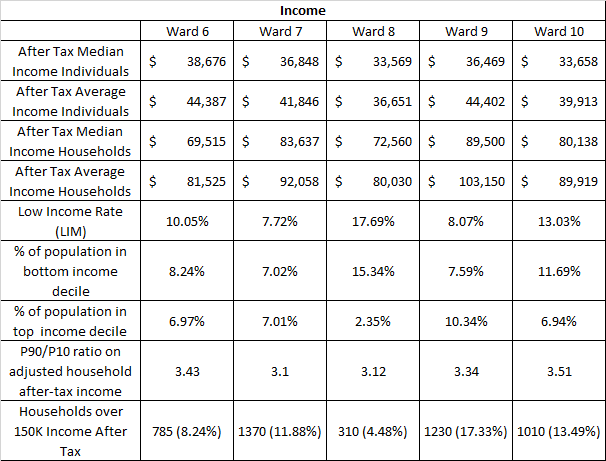
Income
Language and Indigenous Populations
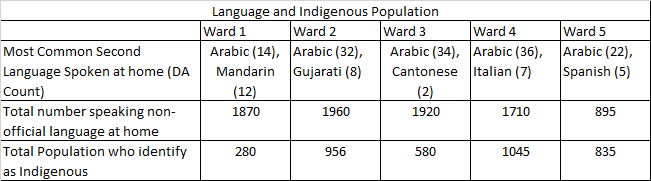
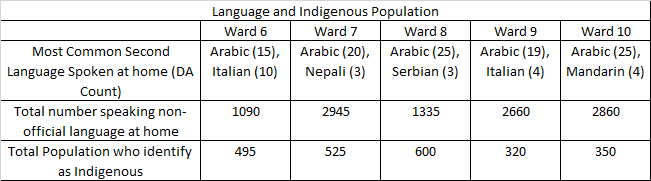
Note there are 383 DA in the City of Windsor – Arabic is the leading second language in 242 of them.
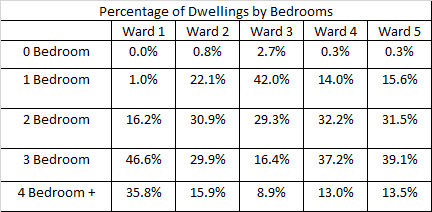
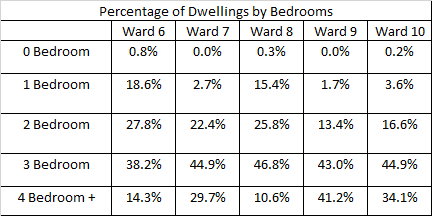
Housing
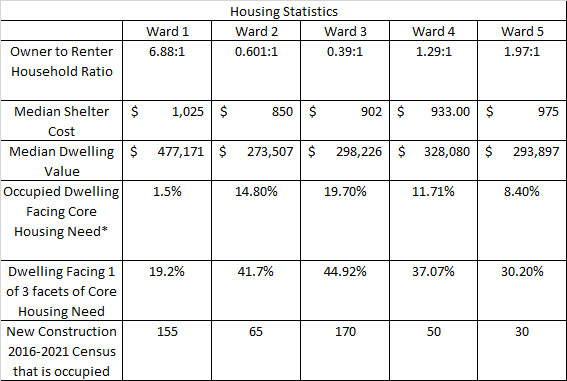
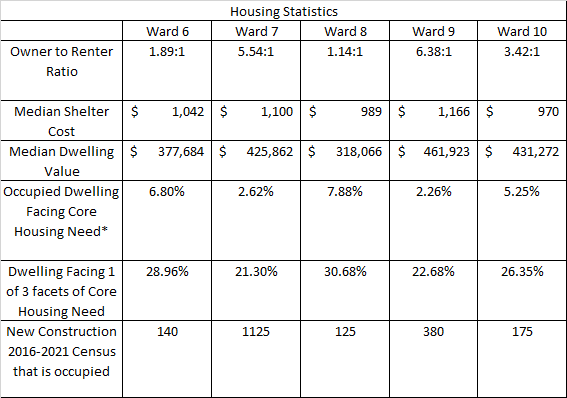
- Core Housing need is made up of three elements:
- Spending more than 30% of income on shelter costs.
- Housing is requiring major repairs.
- There are more people living in the house than the national occupancy standards.
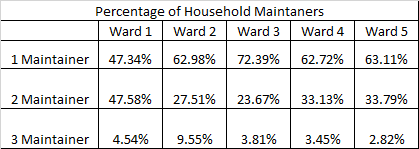
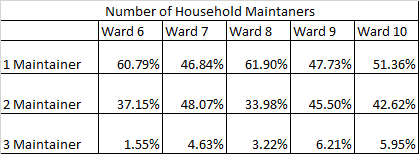
Household maintainer status refers to whether or not a person residing in the household is responsible for paying the rent, or the mortgage, or the taxes, or the electricity or other services or utilities. Where a number of people may contribute to the payments, more than one person in the household may be identified as a household maintainer.
Visible Minority Data
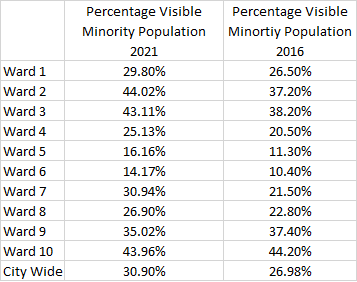
- Obviously the city has become home to more people who identify as a visible minority.
- Ward 9 and 10 saw there percentages decline but due to their population increases it is more likely that non-visible minority populations moved into the areas rather than an exodus of persons of colour.
- Ward 7 had the largest growth while Ward 2 was second.
Immigration Data
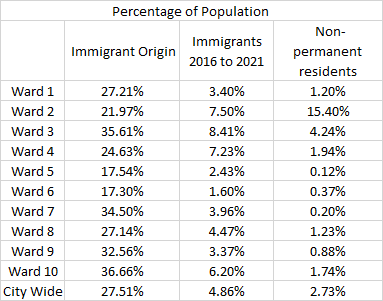
- The City’s core was the largest destination for new immigrants on a percentage basis. Lower housing costs and greater renter availability driving this growth.
- The fact that 15% of Ward 2’s population comes from non-permanent residents is certainly something – with over 3,000 non-permanent residents. I double checked these numbers 4 times….
- We hear a lot that Ward 1 is overrun with students but that doesn’t seem to bore out in the data.
- Frankly I think we seeing here some skewing in the responses rates to this questions as non-permanent residents are less likely to complete the census so it is possible that there is some significant under reporting in other parts of the city. COVID also plays a role as well, as large number of students were not living in the community at the time of Census.
Educational Attainment Data
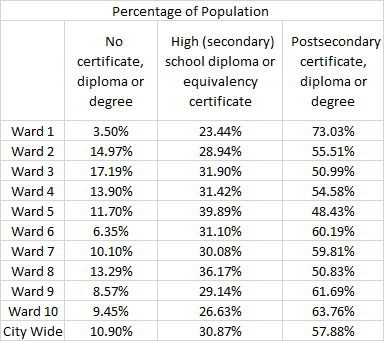
Educational Attainment data comes from population 25-64 years age range so it is excluding the bulk of PSE Students.
- As mentioned in the Census post – Essex County lags the rest of the province in PSE and is home to a higher portion of lower achieving groups than the rest of the county.
Where People Work
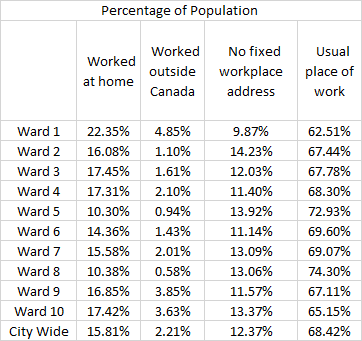
- A new data set that I decided to include for this census, as where people work is a major evolution in employment since the last census.
- Obviously COVID brought about work from home showing where this is more or less common in the city is certainly interesting.
- Windsor’s position by the border creates a unique circumstance for cross border employment.
Commuting to Work
- This transportation data is only for those who had a place of work outside the home and does not include students unless they have a regular job outside of school. As mentioned above the rounding day have a big role in this level of census data.
- COVID as well as work from home likely also impact these numbers.
- It has been widely reported that this region has one of the lowest rates of sustainable transit usage to get to work.
- The unbalance between Ward 2 and Ward 3 with the rest of the City is illustrative of socio-economic circumstance and economic opportunity.
Top Sectors of Employment
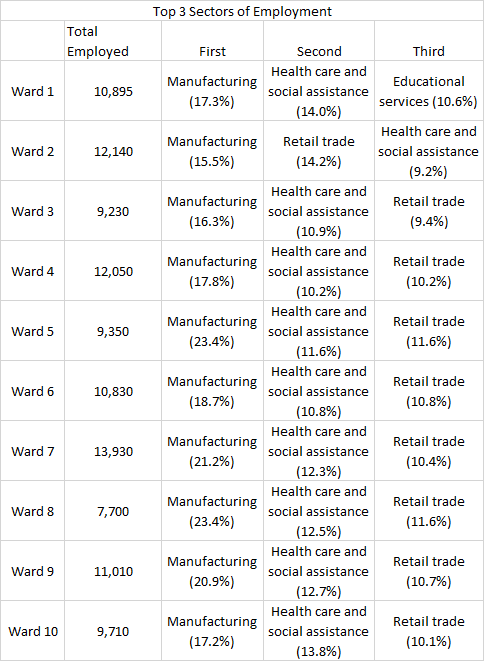
- The sectors employment are pretty consistent across the city and generally a significant drop off after these top three categories.

The % female-led households is staggering, especially when you consider the make-up of the current council. I would love to see a more balanced ratio after October 24th but I’m not holding my breath.
That said, the county is likely to see a jump in female leadership, which I’m hoping will lead to a different kind of leadership.
Pingback: 2021 Census – Language, Indigenous Population and Housing | gingerpolitics