A quiet August release was data on linguistic diversity. This data set is actually somewhat difficult to work with as there are 319 different language options listed as well as a number of sub-dialects within the census data.
It is no surprise that is dominant but certainly understanding where those who don’t speak a first language in Essex County is important from a service offering.
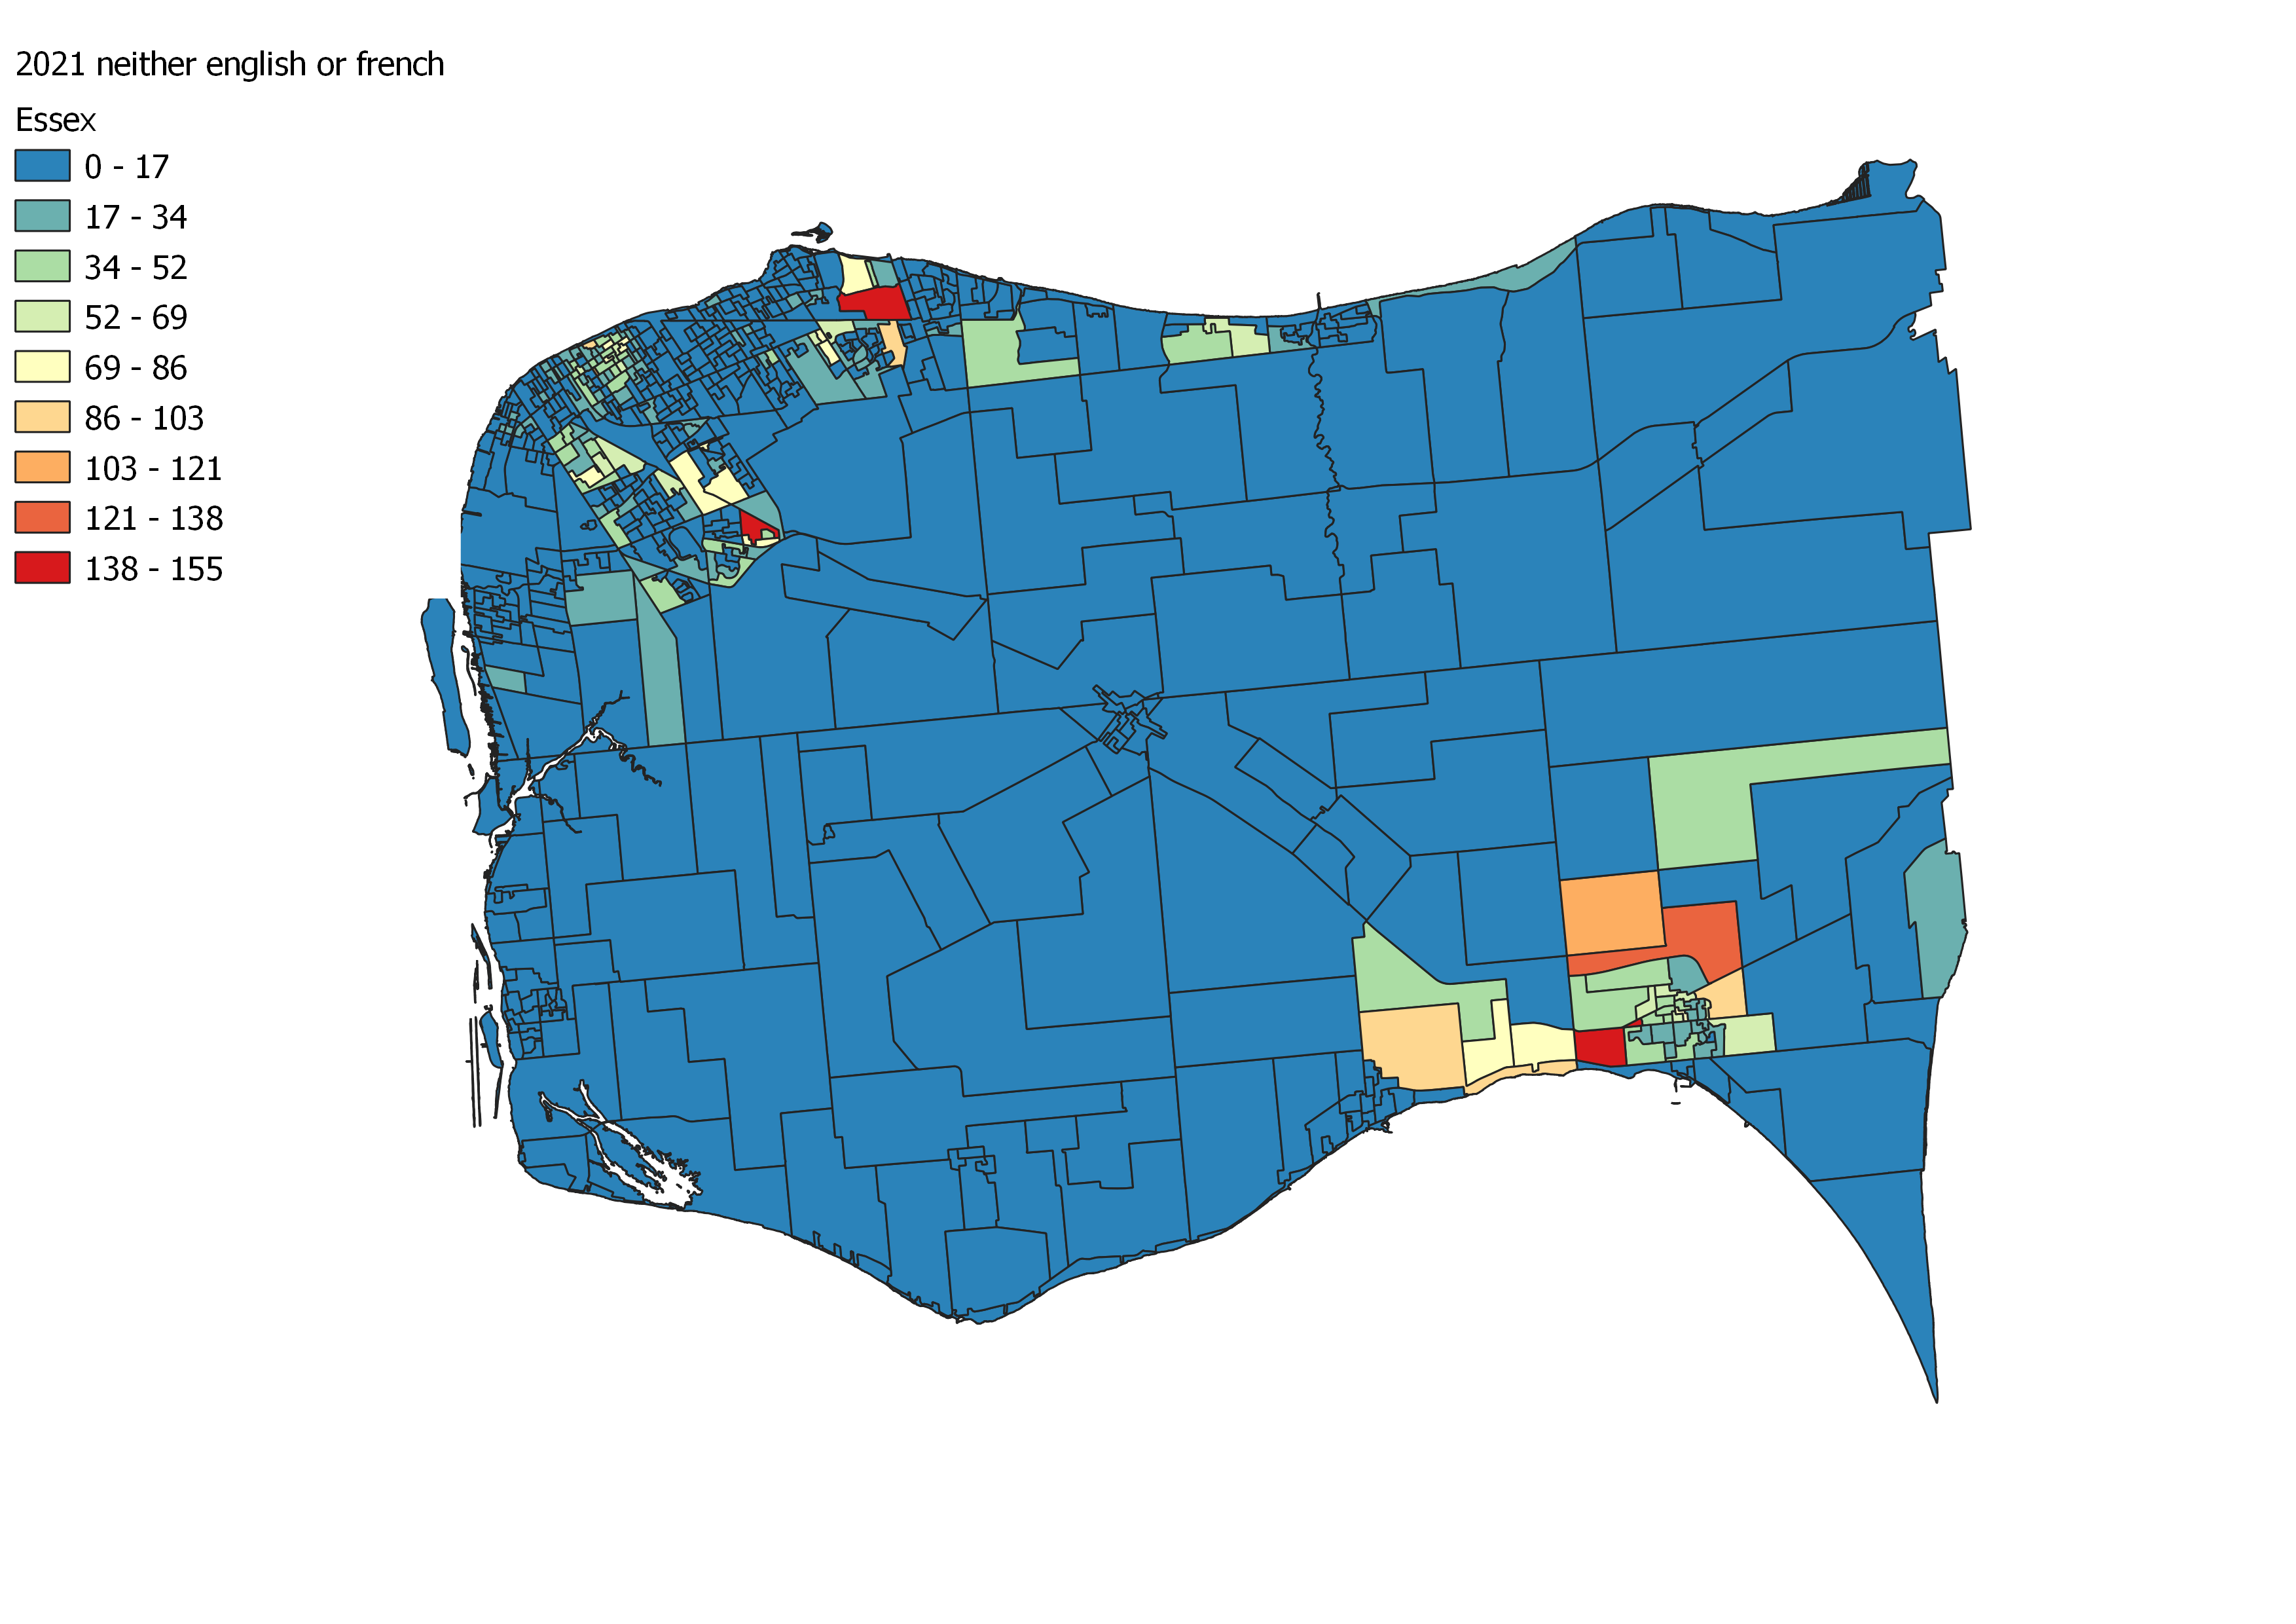
It likely isn’t a surprise that areas around Leamington show up in this data, as migrant workers are captured in the census. Areas of the city that have seen significant immigration of newcomers, East and South Windsor as well as in the downtown core, also show up.
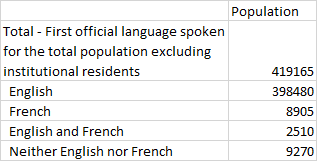
The language data is broadly categorized by two types: mother tongue and language spoken at home. Approximately 28,600 people speak a non-indigenous language (outside of English or French) regularly at home while 95,070 have a mother tongue that isn’t a Canadian first language or indigenous.
What Other Languages are Most Common?
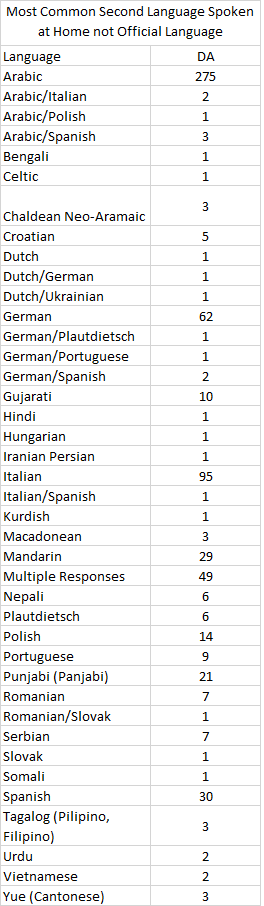
This map of Toronto and the second most common language spoken and I told Sarah Mushtaq it was coming, here it is. A couple of caveats, how Statistics Canada tracks languages is through a series of nested dialect. As an example in a DA “Romantic Languages” may have 50 speakers but then you see 20 Italian speakers, 10 Spanish etc. As a result some languages are nested deeper within the tree particularly for South and East Asian Languages. So there is a question of do you lump them all together or keep the separate, for this exercise I didn’t – I went the second most common identifiable language.
In some case two languages tied, and I list both. In other cases there is a “Multiple Responses” answer to the question, these households where multiple languages are spoken at home – beyond English or French. Generally multiple response areas are where there are very few other languages are spoken.
In many cases the total number of speaker is small, with 10 speakers being the most common other language.
When you map this you see.
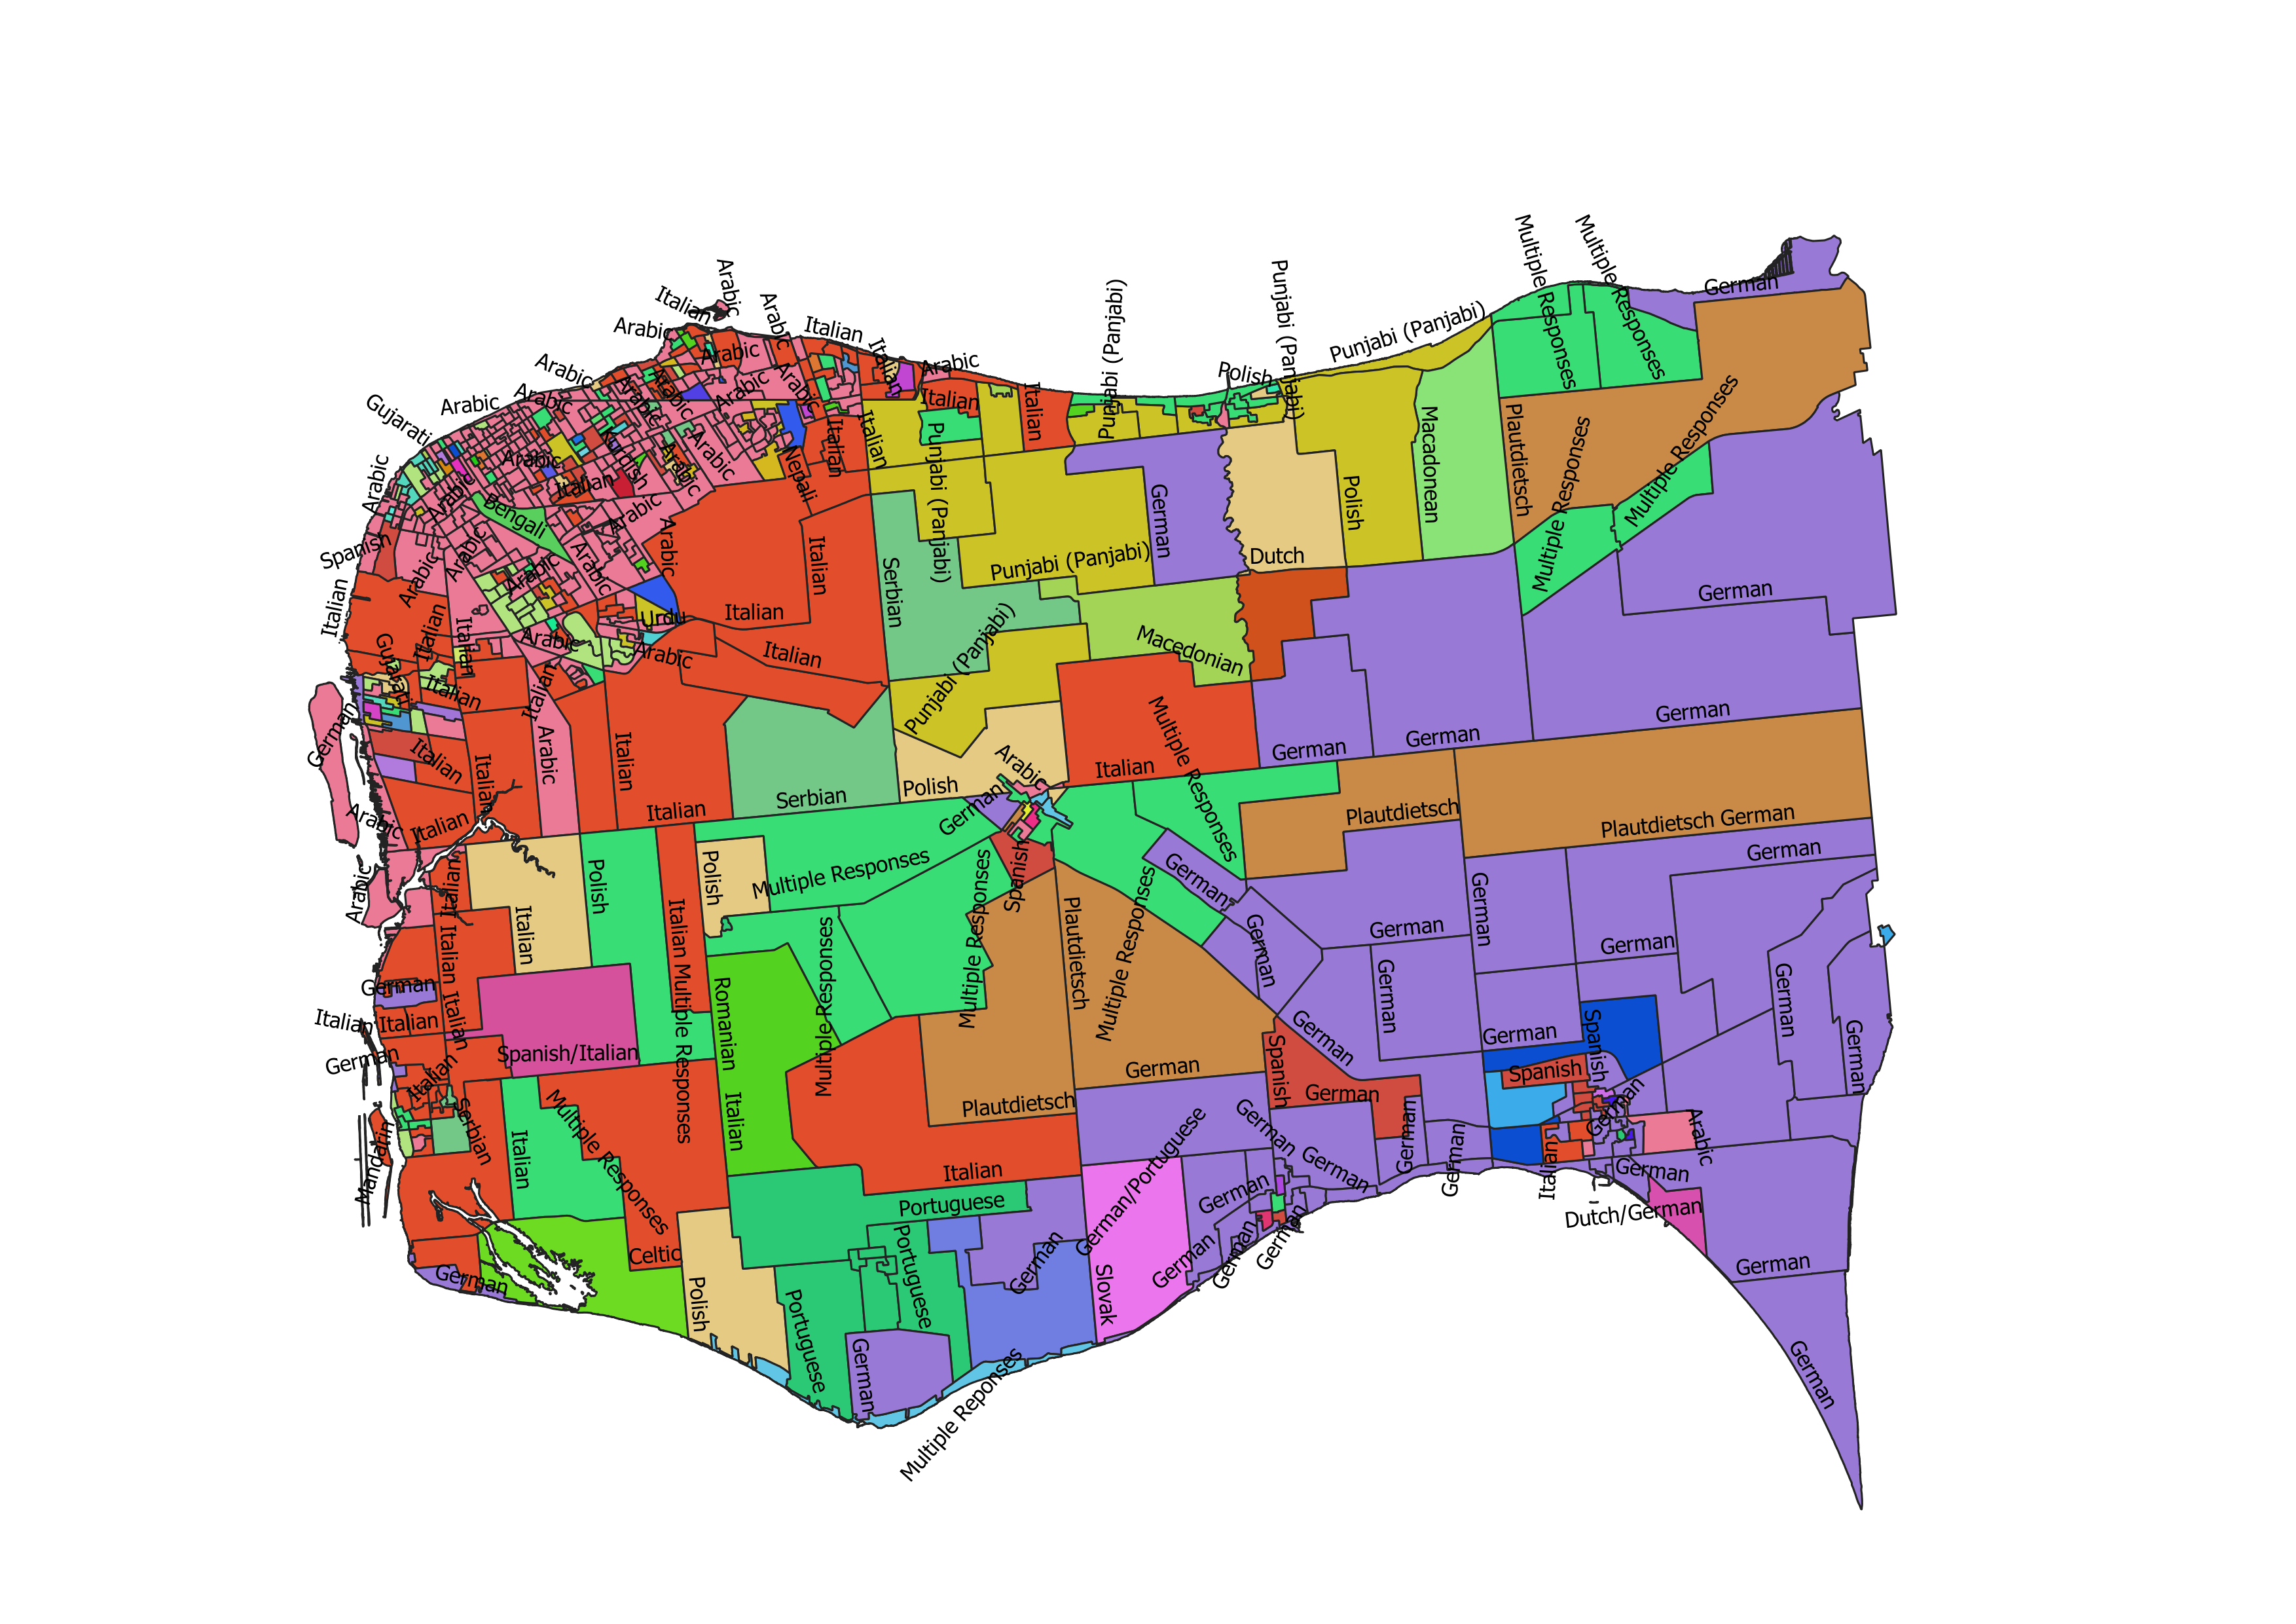
Forgive the crazy labeling, but you can see some major patterns in second language spoken at home.
Indigenous Populations
Within the September Census release there was data on Indigenous populations. Now I am not an expert in this space but the numbers across the region are quite surprising.
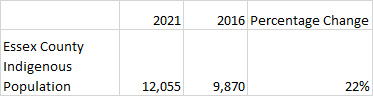
A 22% change in any population group between census is a huge swing. For context, indigenous population grew by 9.1% nationally and overall the region grew by 6.1% during the same period. When considering this change I can identify 4 reasons for this growth:
- Migration to the region. More people with indigenous identity move the region
- Second, indigenous populations have a birth rate well above the core population rate, so we could be in the midst of a local baby boom in this community, in which case ensuring the correct cultural supports are in place for mother and child are important moving forward
- Indigenous identity is a self-identified question which is different than official status. It is quite possible that more people are just identifying with that ancestry. Given the efforts for Truth and Reconciliation Commission and the findings of Missing and Murder Indigenous Women it is possible that people who have always had some indigenous background are now identifying with it. Additional supports nad resources in communities and schools could also be playing a role.
- Finally, indigenous populations have traditionally be under represented in Census data. It is possible that 2016 saw our region being under represented and the actual number was larger this shrinking the overall growth.
Honestly it is likely a combination of some or all of these factors that explain this population boom but
Housing
The rise in housing prices is no surprise in this Census data.
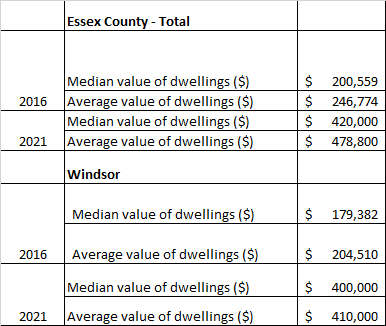
The fact that they doubled while income data was largely bolstered by COVID supports is where I worry. Now despite values having somewhat dip, they are still nearly unattainable in many cases. If you want to see a ward by ward breakdown in the City checkout the update Know Your Ward series.
The other item to thinking about how people are living – renters or owners.
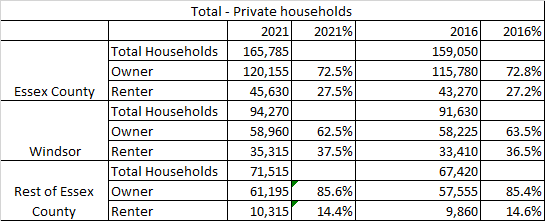
The fact that the County is more owner centric vs the city is hardly a surprise but this does feed into the economic inequality data that was released over the summer. Renters generally have less economic wealth as they don’t own property and can’t leverage that property for additional loans etc. So the fact that our region has high rates of economic inequality is illustrated in the table above.
Much like the poverty data that was discussed over the summer, core housing need is a major topic of importance that often floats under the local radar. It is made up of 3 elements:
- Proportion of population paying more that 30% of income for shelter costs.
- The occupancy of the dwelling does not meet the national occupancy standards.
- The dwelling requires majors repairs
Across Essex County 25.9% of households fall into at least 1 of these categories is concerning. When you map this data you see the following.
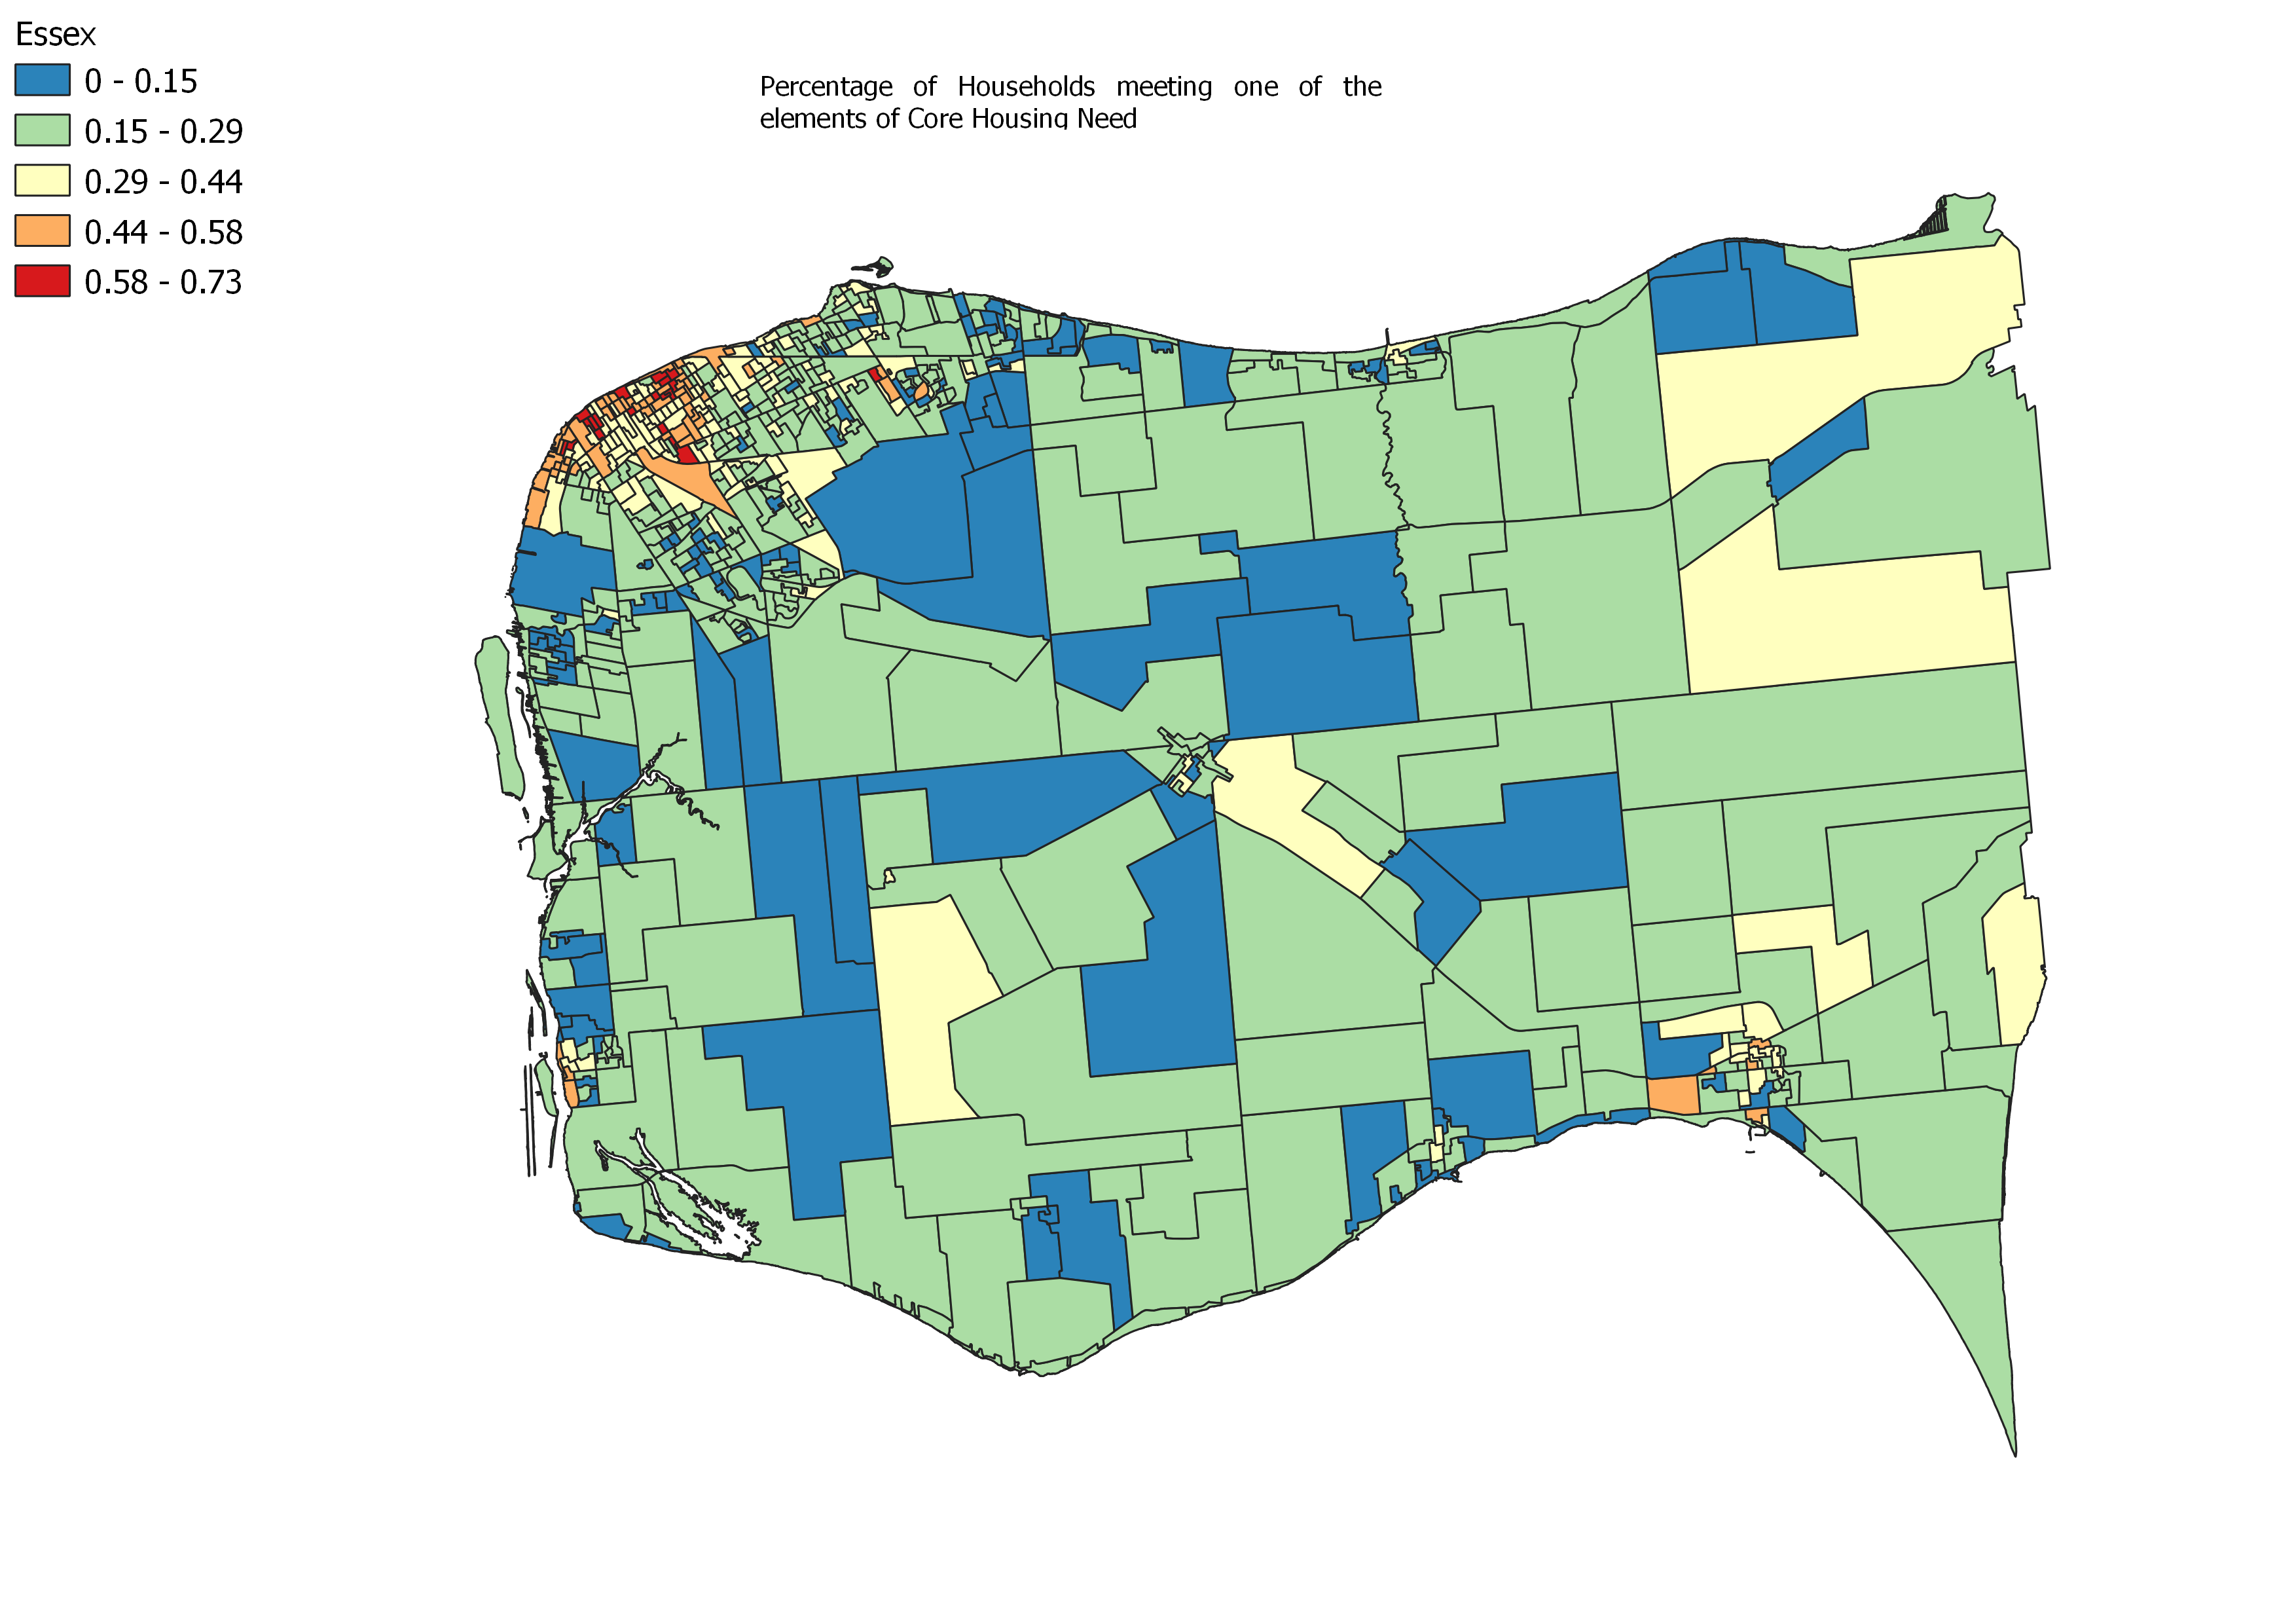
The majority of these highest proportion is kind of where you would expect it, strongly correlated with low income rates. Poor people living in crappy housing. But the majority of the County is covered by at least 15% – average of 67 households per DA meeting one of the criteria should be concerning. These are people who are at risk of being over stretched on their Mortgage in a rising interest rate environment. Or they bought a “Fixer upper” and can’t afford to fix it up. Just as poverty is going to regress to the mean now that COVID supports have been removed, housing insecurity may do the very same thing.
