Much delayed census post that has been sitting half done since late 2022.
This post will merge the final two Census releases from October and November 2022. You can hear me talk some of these stats on Windsor Morning back in December.
Visible Minority Populations
In October data on visible minority populations (ethnocultural groups) is one of the smallest releases of the 2021 Census. I did a deep dive on this data from the 2016 Census here and here. I am not going to completely update that research here but it might be something in the pipeline of sorts.
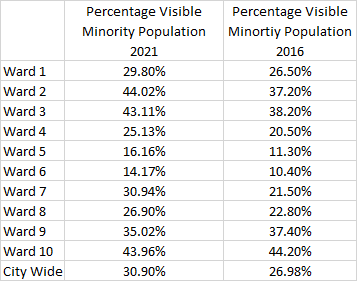
- Overall the City increase the proportion of visible minority populations by 4% between 2016 and 2021.
- The peripheral core (Ward 5, 6, 8) which have traditionally had a smaller portion of visible minority populations
- Ward 7 saw the greatest visible minority population growth, followed by Ward 2. This is likely for two different reasons. Ward 7 is the fastest growing parts of the city and is attracting homeowners and renters to new housing constructions in the area. Ward 2 is likely more driven by student housing for the University of Windsor and to a lesser extent St Clair College.
Looking County wide we see this.
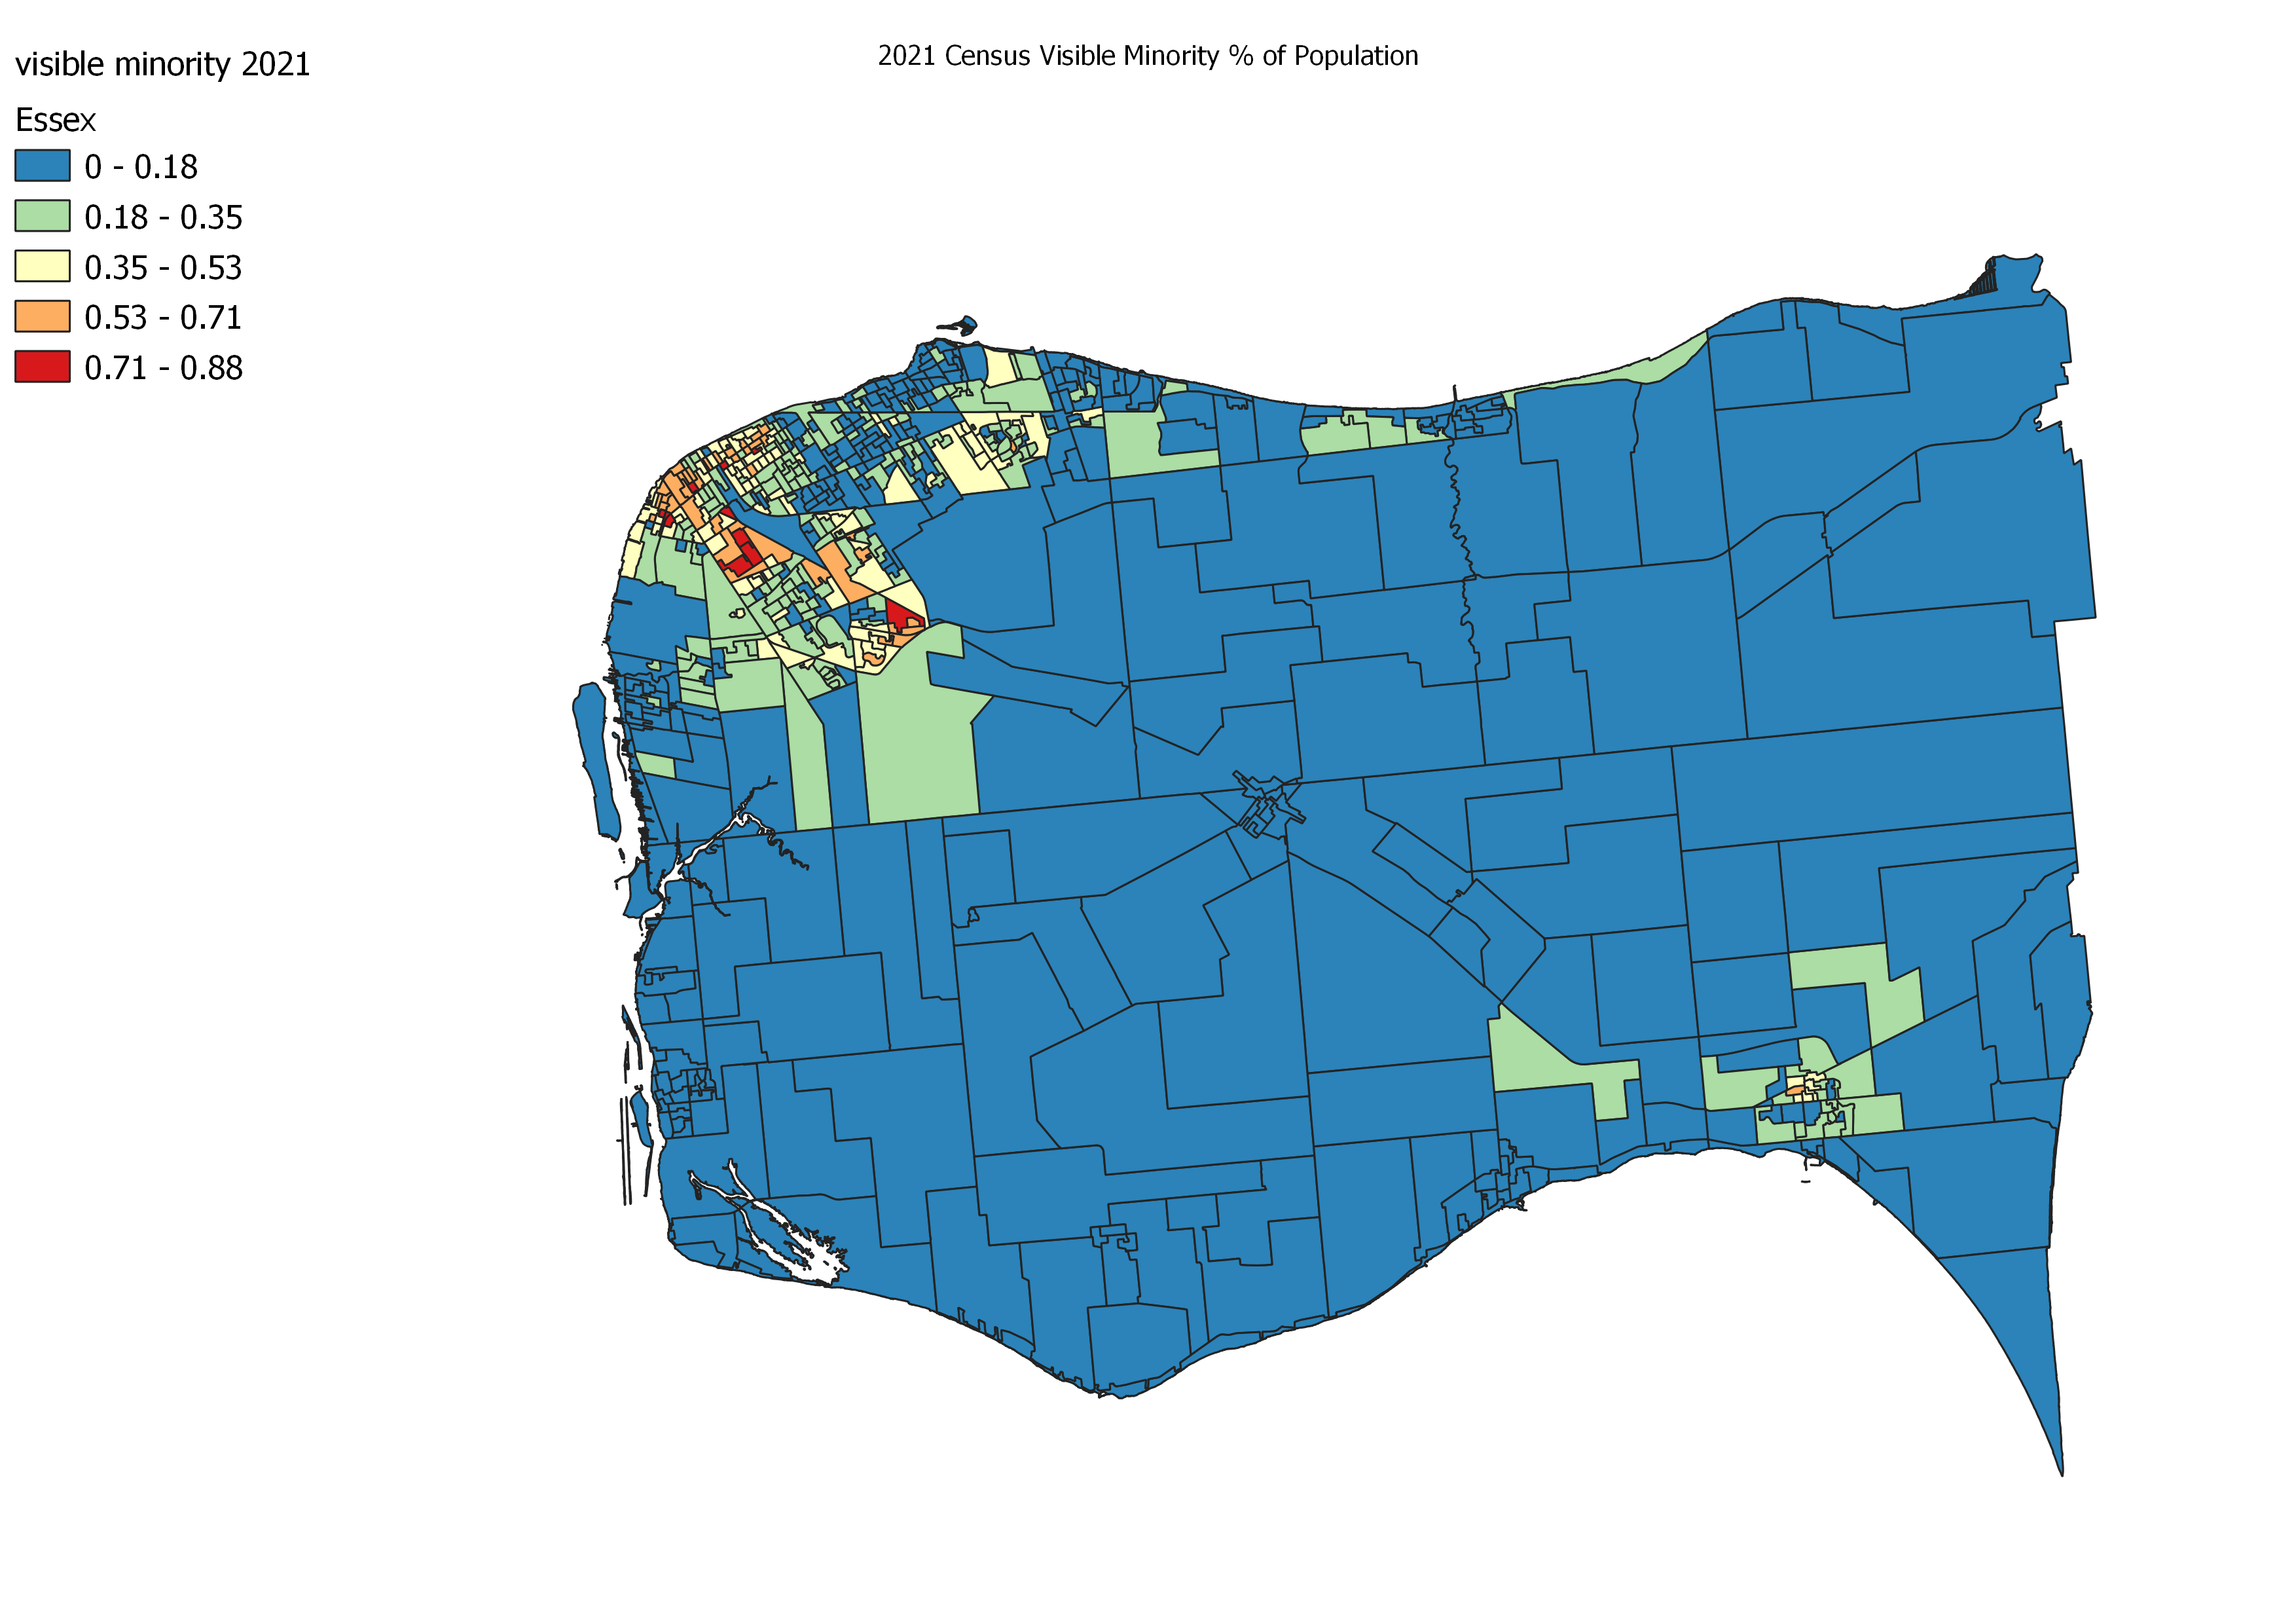
Despite the talk of visible diversity in our region, it is highly concentrated in certain parts of our region.
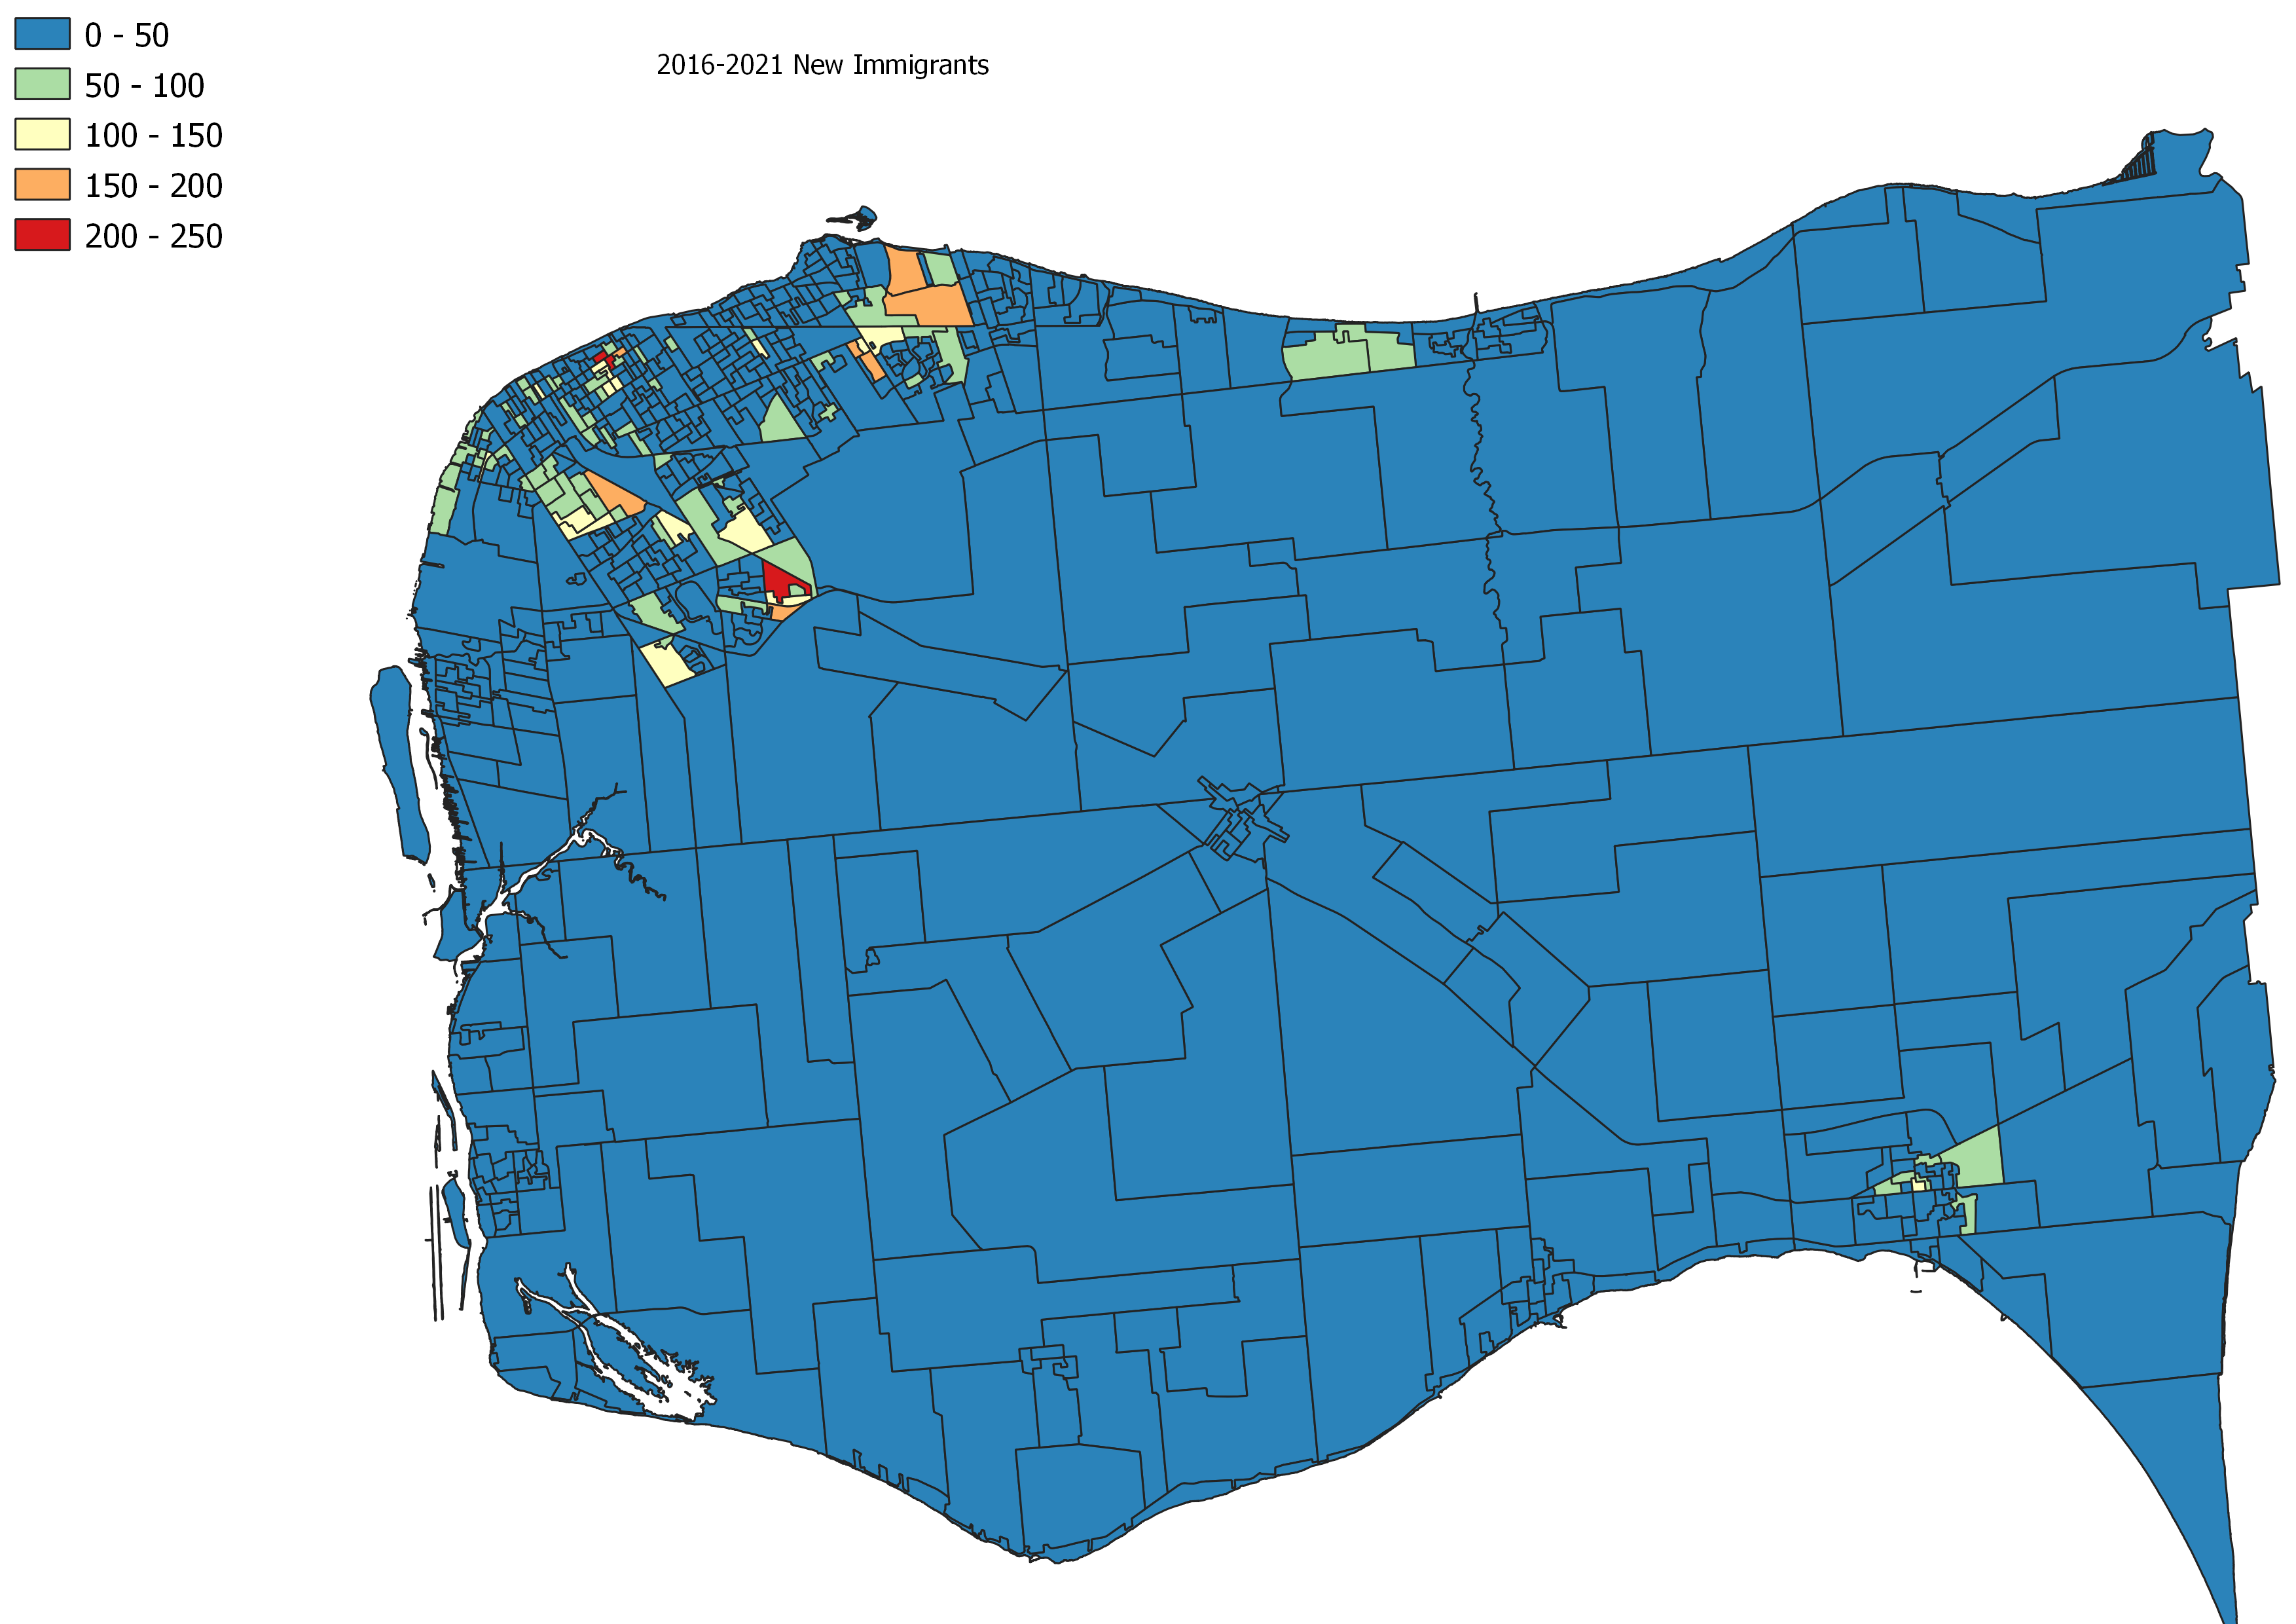
Immigration
Immigration is driving Canada’s population growth – full stop. By 2041, it is projected that approximately 1/3 of Canada’s population will have immigrated to this county.
This is particularly true for Windsor-Essex. Between 2016 and 2021 – 15,835 people immigrated to Canada and ended up in Essex County. Of this number, 12,870 ended up in the City of Windsor. This is up from 11,270 and 8,760 respectively from 2011-2016. The region’s population grew by 6% between census (23,912) – 66% was from immigration.
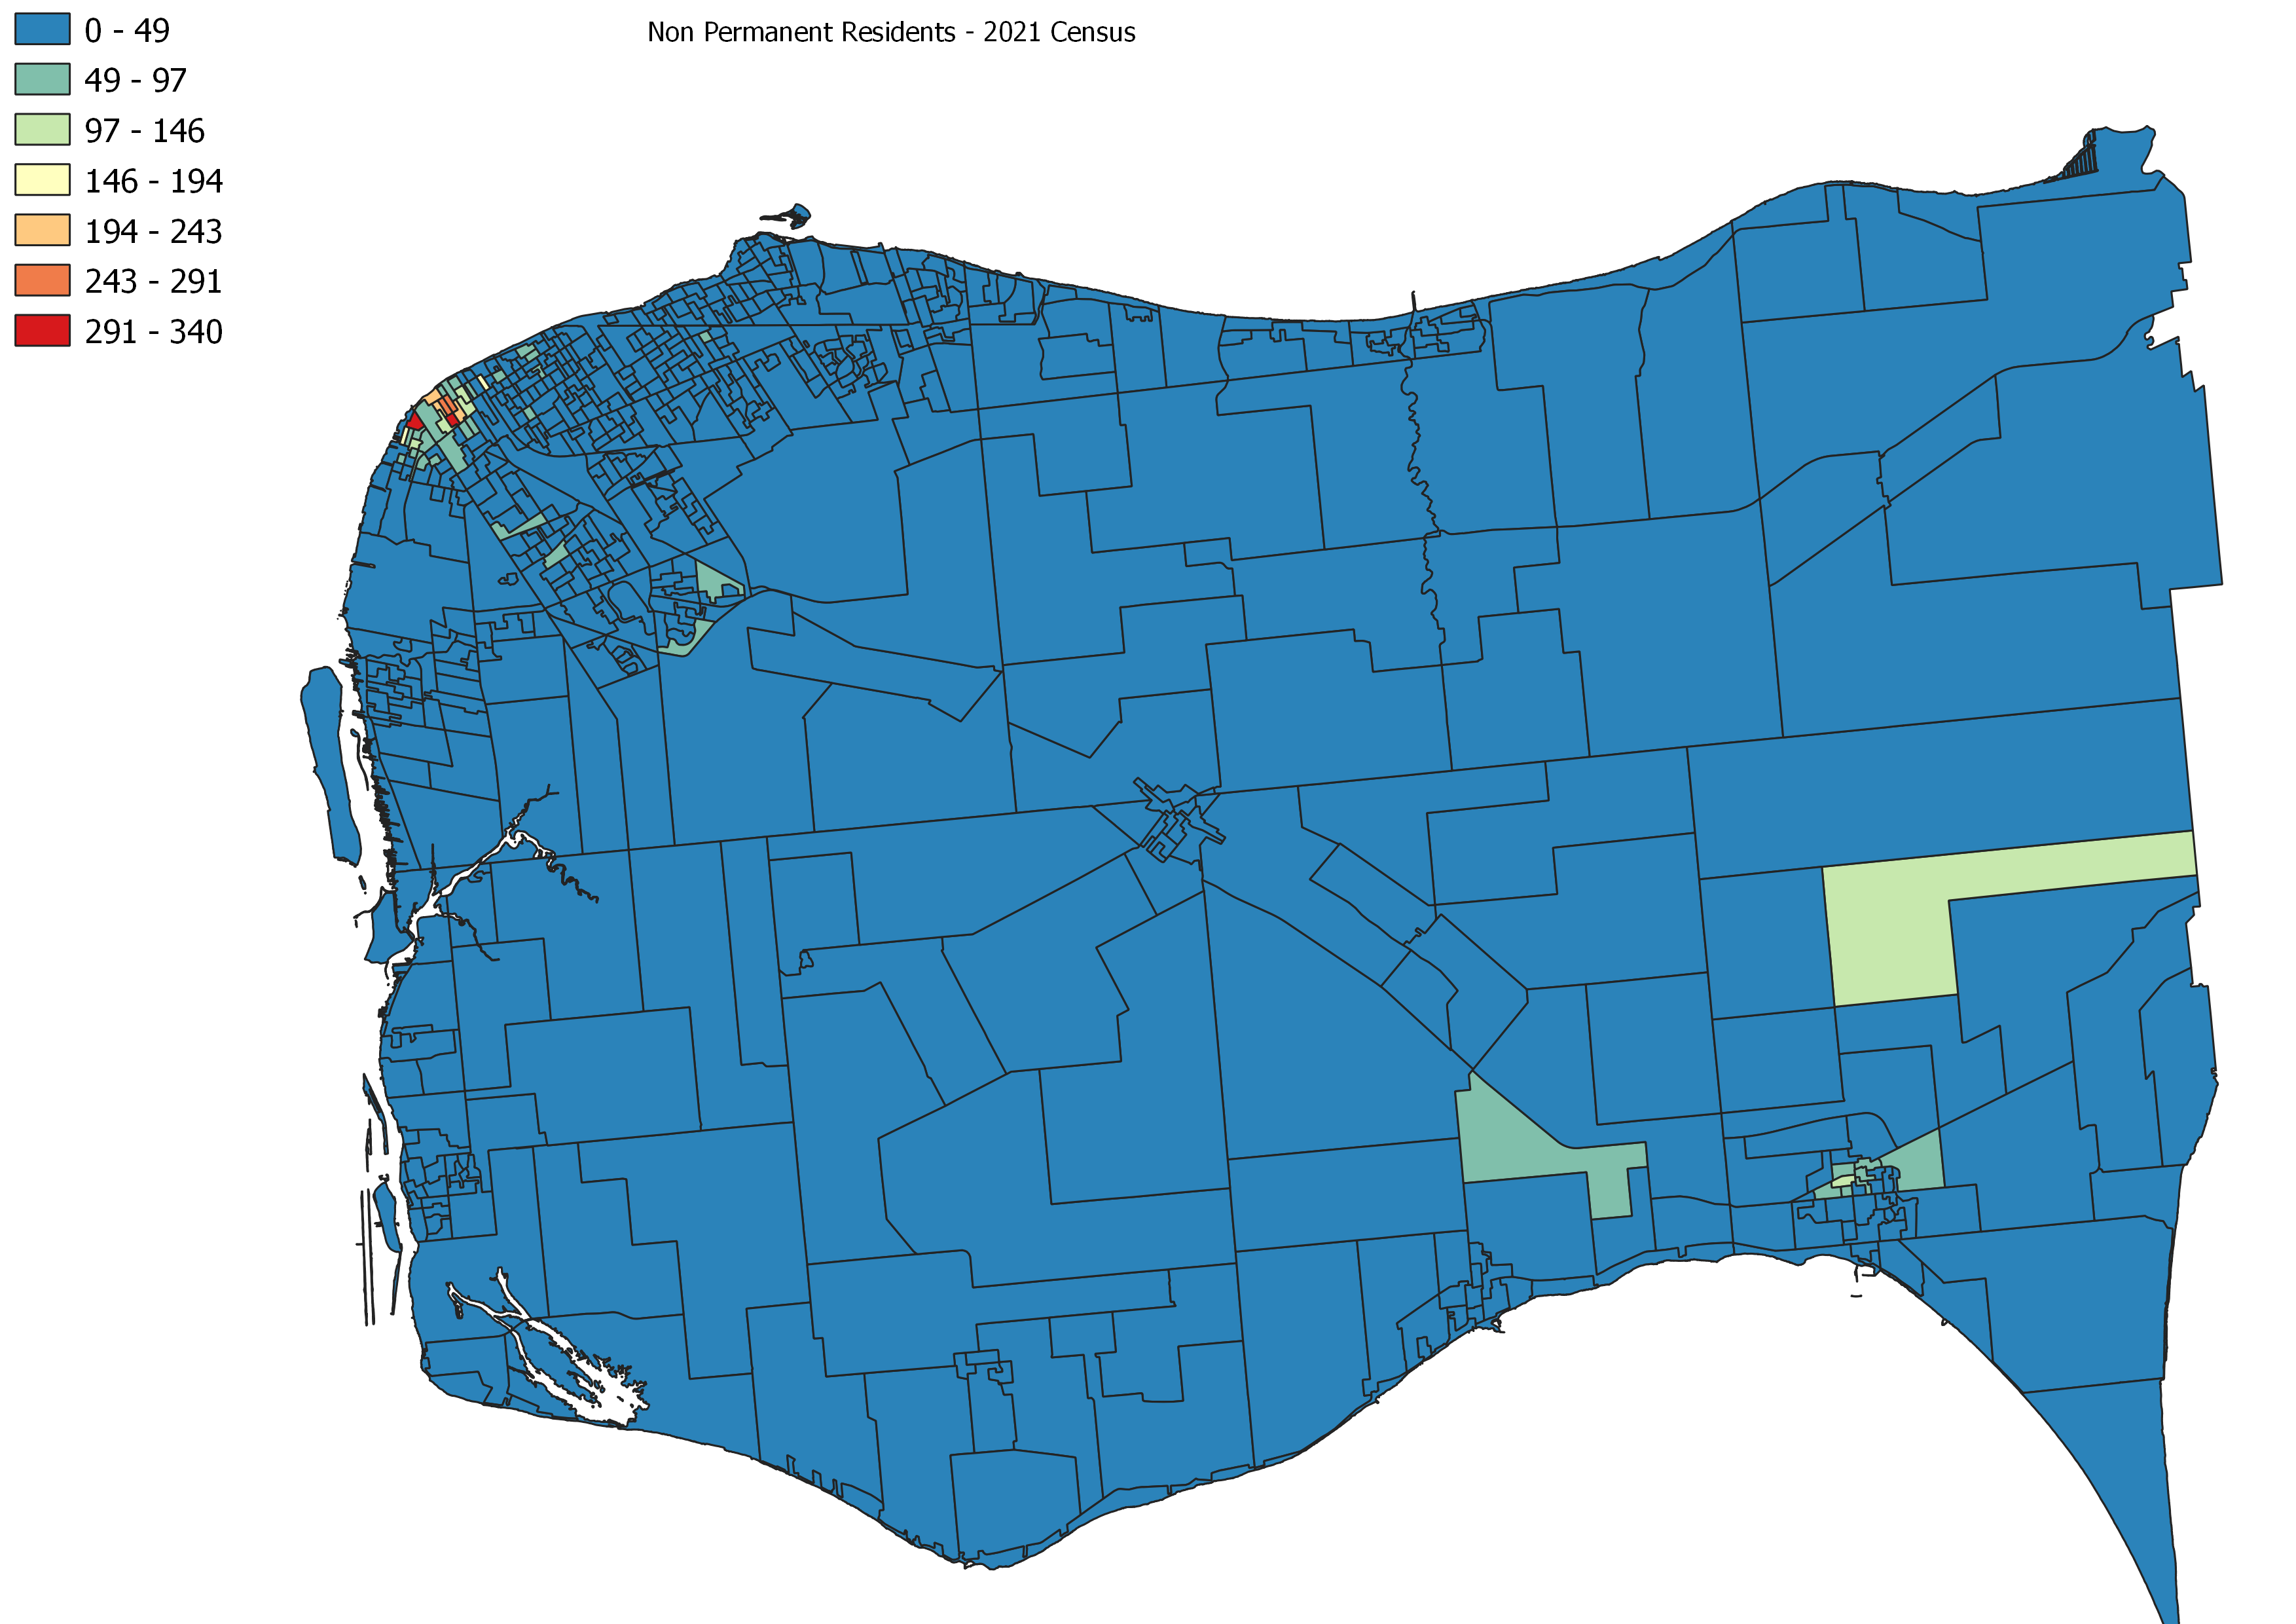
In addition these immigrants, the number of non-permanent residents – (student visas, temporary foreign workers, pending refugee claimants etc.) was 9,255 in Essex County with 7,480 in the City of Windsor. During COVID there were various challenges in non-permanent residents like agricultural workers and international students entering Canada, I would suspect that these numbers are under reporting the true value.
Interestingly, in the cross tabs you can see that Windsor-Essex has taken a larger share of refugee claimants than provincial average. Since 1980 approximate 17.6% of immigrants to Ontario were refugee claimants, while 36.5% of immigrants to Windsor Essex had the same status. Part of this story could be from economic and family immigrants just not staying in the region while refugees who tend to be more economically constrained are less mobile and therefore stay in the community. Some of this may bare out in the age of Immigration data.
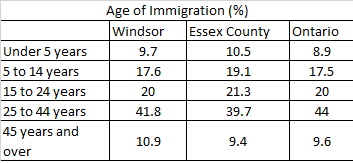
This data is based on when a newcomer receives permanent residency status so in some cases they may have already spent time in Canada (as a student for example) for several years. Compared to the province both Windsor and Essex County has lower proportion of young working immigrants with higher rates of youth under 14.
Education
Nationally, again immigration is raising the level of education attainment to leading status in the G7. This is a very good things as we are attracting some of the best and brightest to offset our aging population. That being said keeping that talent here locally is very important. As I have mentioned on this blog before one of Windsor/Essex County Achilles heels is poor overall educational attainment. This trend unfortunately continued in this Census with Essex County still lagging provincial educational attainment levels
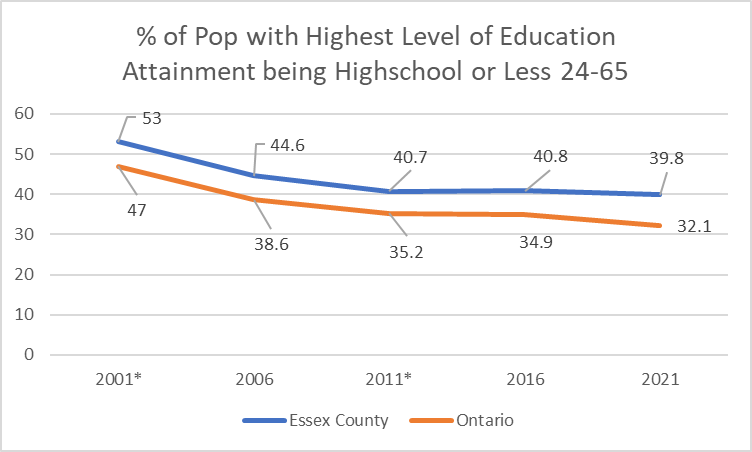
I think it is clear now that Windsor has an education attainment problem. Historically part of the blame could go to auto-industry employment pipeline where people would walk into jobs from high school and be secure going forward. As boomers age and requirements for manufacturing jobs have risen, our attainment rates have improved but seems to plateaus with 2 out 5 work age adults have only a high school diploma or less.
Part of the story also seems to be originated from immigration data. Now this isn’t to say that refugees are coming to our community without education, there absolutely are people arriving who are highly educated, the issue are twofold: first, recognition of that education – if a college diploma from X country isn’t recognized or accredited here, it immediately drops a person down the educational ladder. Second, part of the over representation of refugees in the Windsor Essex region could also be due to the region somewhat poorer at retaining economic immigrants. As economic migrants tend often come to Canada credentialed and as well as with job lined up – which can in the medium term, give greater mobility within Canada. Thinking locally what portion of international students, which often transition from education to economic immigration candidates, stay in Windsor Essex? If we are just a stop on their immigration journey, what are we losing?
Employment
The employment data from the 2021 Census is disrupted due to COVID. Whether the surge in work from home, border restrictions or the uneven nature of certain sectors being impacted by the various restrictions.
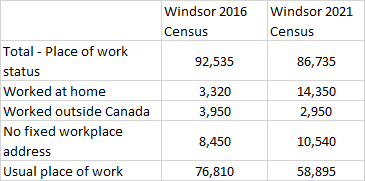
The above is just for the City of Windsor but you can see the dramatic shift in where and how people were working. Sector by sector data is available for 2016 and 2021. Obviously the decline in almost 6,000 people working has to do with COVID impacts and shutdowns – the border closure accounts for some of that where people lost their jobs or shifted to WFH during the pandemic. The rise in no fixed workplace helps illustrate the construction boom in our region as that sector remained strong through the pandemic, growing by 1000+ workers between 2016 and 2021.
One category that caught my eye was – Management of Companies and Enterprises which in 2016 only have 45 people in that category in the City of Windsor. The vast majority of whom had regular places of work with ~15 of them crossing the border to work – none worked from home. In 2021 this number grew to 125 individuals with 70 working from home! This could represent senior executives coming to Windsor during COVID.
Commuting and Journey to Work
The Windsor CMA (all of Essex County) ranked at the bottom of using active transit to get to and from work. Census data does have some challenges in tracking this as questions only relate going to work, only measure population over the age of 15 and as with this entire Census it was captured during COVID. That being said in the 2016 Census Windsor CMA (Windsor, Tecumseh, LaSalle, Lakeshore and Amherstburg was last in Ontario for sustainable transit usage. Getting to and from work is important, there has been lots of debate about transit and other sustainable methods of transport in our region. This map sums up the City of Windsor:
This includes Walking, Biking, Transit and the Other category from the 2021 Census. It is slightly under reporting as it only includes regular trips to fixed employment (not students unless they reported in the census going to work). Obviously this is being taken during the pandemic like all of the census data, so there is a skew that is likely suppressing the number transit users and general people going to and from work. What this data does show are the parts of the City and people who had to use transit (or other active means) and still go to their place of employment during the pandemic.
One of the interesting crosstabs that is available is how new immigrants and non-permanent residents use transportation to get to and from work compared to the general population.
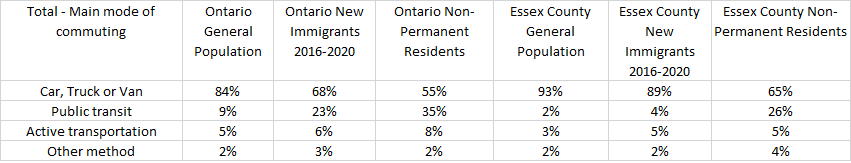
The contrasts are really clear between our region and province particularly with subpopulations. Digging into these numbers there are likely some dynamics around built form and affordability, inequality, economic capacity and preferences and choices.

Pingback: Immigration and Poverty in Windsor-Essex | gingerpolitics