Hello darkness, my old friend….
- A bit of shameless self-promotion from me to start with!
- I am quoted in this piece by Doug Schmidt on Food Poverty and impacts of rising food prices. Rising prices compared to low wages may be a feature of a future long read post.
- This piece the impacts of Begley’s School closure and the socio-economic make up that the neighbourhood (more on that below).
- A shout out on Dan MacDonald show by Sarah Mushtaq as she was expanding on her great column. The Windsor Star needs to pay her more money and stop calling her columns “Reader Letters”.
- And the latest Mean, Median and Moose Podcast is out! In this podcast we discuss ranking of rankings, do some of our own rankings and talk about what we missed from Statistics Canada in November.
- Digging in a bit more on the Begley story (linked above), I went and built a custom Begley school catchment based on these boundaries. Some important caveats:
- There are kids in this neighbourhood that go to French or Catholic schools in other boards or French Immersion or other programs in the Public Board. We have no information on how the socio-economic factors that are at a neighbourhood level are distributed across students in schools.
- The census boundaries do not align with school boundaries. As a result I had to choose to either leave fringe boundaries out or include areas beyond the catchment. I used larger boundaries so the numbers below are impacted by having a larger total population than the actual catchment.
- Finally this is from the 2016 Census which represents 2015, which not only missed the last several years of change but we know that this neighbourhood was a landing spot for a number of Syrian Refugees post-2016 and not captured.
- During my interview Jennifer La Grassa, I was obviously asked about data, unfortunately because school catchments don’t have publicly available datasets getting specific indicators for barriers is a challenge (outlined above).

- That being said the neighbourhoods and census boundaries that make up the Begley school catchment area do face significant socio-economic challenges.
- The Average Census Family size is actually misleading from a Begley student perspective. The catchment covers the “high rise” apartments that are in the downtown core. This census catchments skew significant more senior, averaging 34% seniors vs 11.9% in the rest of the catchment. If you remove these areas from the average census family size is 3.05 in the rest of the catchment.
- The reverse is true on rooms per dwelling which sees the average outside of the core areas rise to 5.15 rooms (3.27 rooms in the core areas). The bachelor an one bedroom units in the downtown lowering the overall Begley school catchment. Despite this dwellings in the Begley area are still over a full room smaller than the city average.
- Housing suitability and more than one person per room are approximate metrics of “overcrowding”. Controlling for the core areas raises the person per room to 7.1% and not suitable to 10.1%. Although these numbers are low in the grand scheme of things, during a pandemic, a percentage point change represents 3.6 households in the Begley catchment. This means that in each dissemination area that makes up this catchment, a few dozen households are at elevated risks.
- The County of Essex 2021 Budget draft is available for review. Will be deliberated December 2.
- Leamington’s Budget is up for review too! They have a 3 day review process, Windsor seems to do it in 1 or 2.
- This twitter thread is interesting
- A shoutout to my colleague Taimoor for his take on COVID-19 impacts on Immigrant populations and what can be done locally.
- This story on Amazon’s hiring spree – largest workforce mobilization since World War 2?!?!?!
- This report by Jim Stamford on how childcare expansion would grow the economy
- This story on McKinsey and their overdose payments to pharma-companies.
- So I saw these charts on Facebook….. <sigh>


- The above images are calculated from this data, looking at the first portion of 2020 and total deaths in Canada compared to pervious years. Statistics Canada hasn’t inputted updated October/November numbers at time of writing.
- A Facebook friend shared them and I started thinking through the implications. He was speaking to how it should mean easing of restriction but I see it differently.
- What is interesting is the behavioural change. Yes total deaths as an aggregate aren’t much different than other years (at that point in time) but that is because people have behaved differently. Three quick examples:
- During lockdown during March and April – road traffic declined between 50-80%. In Canada, historically ~5 people per day die in traffic fatalities. Given the decline in traffic it would be unsurprising if the total deaths declined as well. Even if it 2 dying per day, over the course of the rest of the year that is hundreds if not thousands of deaths not occurring.
- Due to bars being closed – drunk driving arrests and other violent crimes decline in the US and is likely comparable to Canada.
- Think about rec sports and gyms, most of which have been shutdown this year. About 1.4M sport related injuries in Canada each year – gyms, sports leagues etc. all were shutdown so the percentage of deaths shrinks as well. (older data but only Canadian source)
- An argument emerged was that other deaths have also risen during COVID. I don’t disagree that there are more deaths from other causes. I agree opioid deaths have risen (Ontario number here for the first bit of the year) as have other like suicide and cases of domestic violence that can lead to death.
- In some cases spikes certain deaths are tragic but on aggregate are a small total increase compared to the approximate 280,000 deaths that occur each year in Canada.
- Between Jan 2016 and March 2019 – 12,800 individuals died of Opioids across the country, we have had just over 11,000 COVID deaths – ~2.5 years of opioids deaths in 8ish months.
- Current COVID deaths equate to 5X the number of who die in traffic accidents in Canada (about 2000 people) each year.
- What we are talking, as gruesome as it is, about is marginal change in deaths across society. It is quite possible that some portion of the 8,612 deaths in LTC would have been deaths that occurred anyways this year had COVID not happened. That being said, just because 75% of deaths in Canada doesn’t mean that looser restrictions should be available to the rest of us.
- That ignores the fact that 2,884 people have died outside of LTC.
- It also ignores that broader community spread could/would lead to additional infections in LTC as staff or visitors bring the virus into facilities.
- If COVID never happened no one would be surprise if the number of deaths were about the same. The fact that deaths are on pace to be around same total deaths (at the point in time that data is available) illustrates the shift that has occurred in society, that prevented other deaths to offset spikes from COVID-19 and mitigated rises in deaths
- In my opinion this is not an argument against locking down. It is only because those who are healthy and capable, changed behaviour that we aren’t just adding the COVID death toll to however many Canadians would die anyways. Locking down forced behaviour change from some people who would not have voluntarily changed, it has imposed burdens and sacrifices on other (small business owners) but the proof is in the data, we have shifted the national death curve.

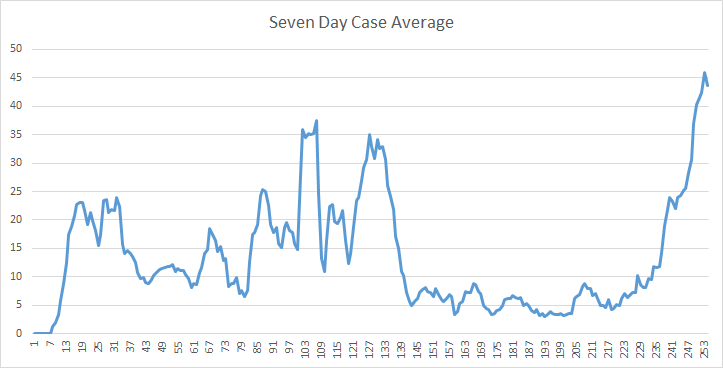
- Here we are, code red! A minor glimmer of hope is that the 7 day average dropped slightly on Sunday from a high on Saturday.
- Izzy is ready to hunker down, how about you?