
As an early valentine gift to nerds like me, Statistics Canada released the 2019 population estimates for Canada. What is important to say is that these are population estimates, not actual counts which occurs during the census. These estimates are built from a model based on data at the time of the census and then accounting for births, deaths, immigration and emigration etc..
Now the top line that Windsor CMA in 2018 was the 3rd fastest growing CMA (not City!!!!) and it fell to 15th in 2019 is actually less important than made out to be in my opinion. Year to year population change is highly erratic as relatively static local birth and death rates tend to be near constants in the model. As a result immigration and emigration of all forms tend to drive year over year growth and is driven by a combination of administrative data inputs and estimates. An example administrative data usage comes from CRA data, whether the total number of tax-filiers for previous years in a particular year would be inputted into the model as piece of the population estimate.
So what is happening?
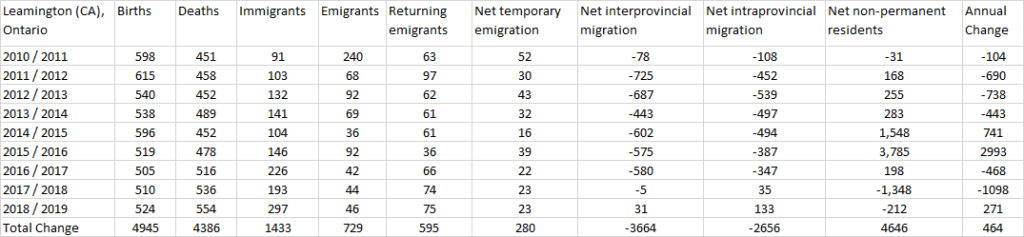
The top line numbers look like this:
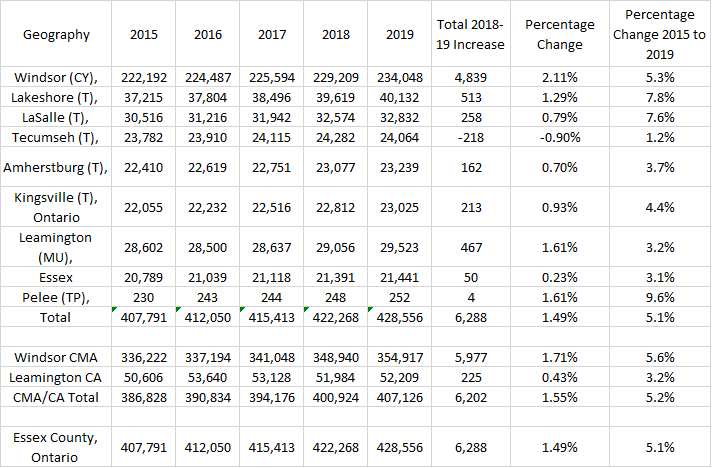
From these top line numbers there are a few things to takeaway. First as this a model, the numbers aren’t necessarily the exact same as what emerges from the Census.
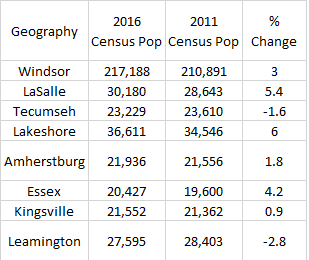
There are several thousand person difference between the Census counts and the models based estimate that were released last week. Although the Census never gets a 100% response rate, the population count is one of the more accurate metrics that are collected. As a result there are a variety of technical reasons why the models output different population values, particularly at municipal level which are largely baked into the assumptions of population growth between censuses. Setting this aside, year over year change is highly variable and as population grows, consistently having a high growth rate becomes more challenging.
The biggest takeaway is the narrative of the County driving regional growth, based on the estimates, seems to be challenged when looking at the City’s population numbers (more on that later). Both the City, LaSalle, and Lakeshore all exceed the regional population growth average since 2015 of 5.1%. Due to the City’s scale it attracted more far more people while LaSalle and Lakeshore grew at a much faster rate and Lakeshore potentially surpassing 40,000 people in 2019. Tecumseh seems to be an outlier in the data as it saw its population shrink not only in the census count but also in these population estimates between 2018-19. The Tecumseh story is actually really interesting (possibly another post) as I think there are a couple macro-economic trends impacting the town that are driving it’s slow/negative growth compared to other parts of the region.
Essex’s growth saw less than 100 new arrivals in town between 2018/19, given the town only had 59 new units completed (note: this is 2019 calendar year not July 2018 to June 2019 population estimate year) last year the slow growth may not be surprising. As for the rest of the south shore, Kingsville and Leamington both saw tepid growth with Leamington recovering the declines reported in the Census.
One challenge is that the data available at a municipal level doesn’t explain where the people came from and what type of migrant (for the lack of a better word) is coming or leaving our region. For that you need to jump to the CMA/CA level.
Who is coming and who is going?
A big piece of the release data comes at a CMA (Windsor, LaSalle, Lakeshore, Tecumseh and Amherstburg), CA (Leamington and Kingsville) and Census Division (County of Essex). Breakdowns of ages, types of arrivals and from where in Canada are all available. Mike Moffatt, released this post that breakdown a lot of the information at a Census Division level.
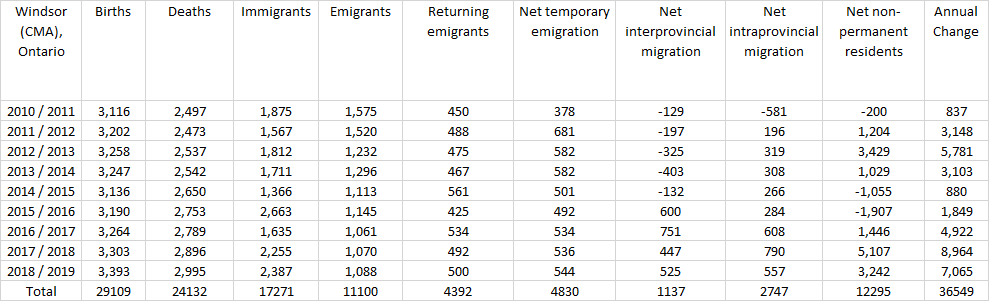
Population growth is driven by 9 factors: births, deaths, immigration, emigration, returning emigrants, net intra-provinical (out of province) migration, net inter-provincial (within a province) migration and finally net-non permanent residents .
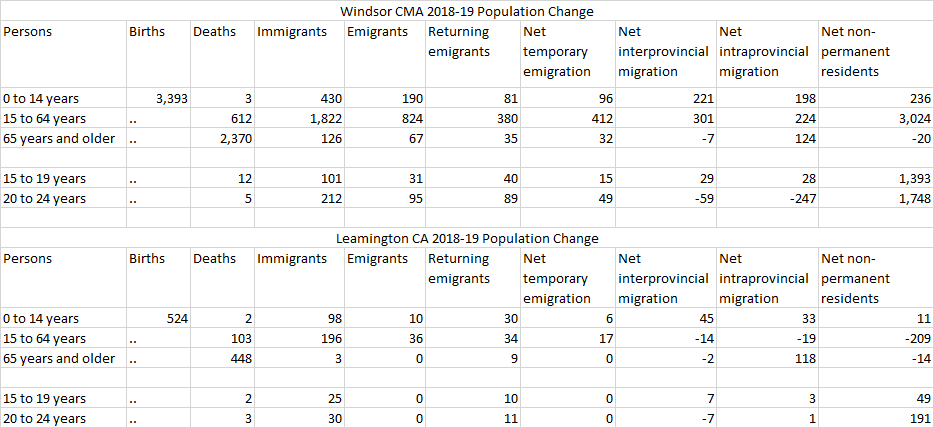
It is pretty clear where a big chunk of population growth came from last year, non-permanent residents in the Windsor CMA. Given that almost all of the are in the 15-24 age range it is likely that this net non-permanent residents are here for education. The data doesn’t point to significant permanent population growth in the Windsor CMA, rather 3,024 of the 5,977 net population growth comes from temporary non-permanent residents. The growth without the temporary residents only equates to 0.8% within the CMA.
There is no question that the Windsor CMA has been growing, the question is how is this growth spread over the 5 communities of the CMA. Approximately 1/3 of this growth is coming from non-permanent residents which breed the question, what portion of those individuals are we permanently capturing into this community?
The often forgotten about Leamington CA (made up of Kingsville and Leamington) has largely stagnated at a population level. Since 2010 based on the population model the sub-region has only seen a 463 person increase.
Looking back beyond just last year, net non-permanent residents has been the driver of population growth in the southern part of the County. This isn’t necessarily a surprise given the growth of the greenhouse sector but the recent declines are certainly interesting. Without these temporary workers, the Leamington CA would be bleeding people to the rest of the province and Canada. When you dig deeper into the inter and intra provincial migration data, you find that those leaving the community tend to be younger adults while they are being marginally replaced by those over the age of 55+.
Where are they coming from?
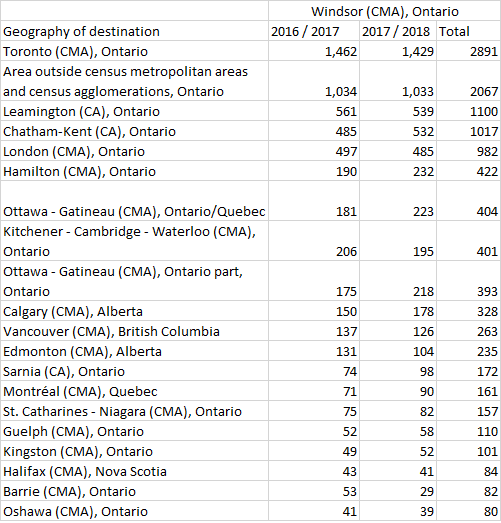
Another piece of data that emerged are the destinations and origins for people moving in Canada is available since 2016/17 year. The top 20 communities that saw people come to and leave from the Windsor CMA, were:
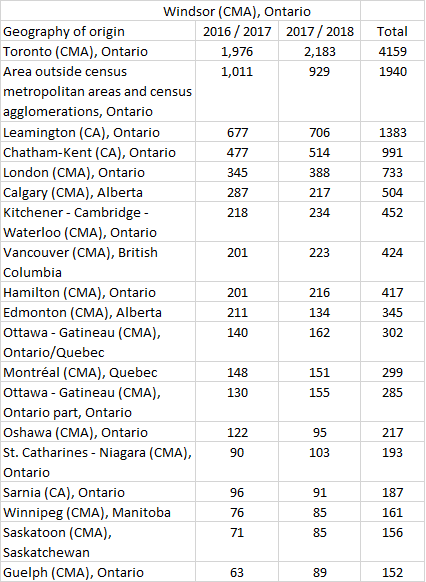
One common thread across these coming from and going to measures is that “Area outside census metropolitan areas and census agglomerations, Ontario”. This is largely the Town of Essex (and Pelee Island) which are outside of the both Leamington CA and the Windsor CMA. Although other rural communities in Ontario are included the exact breakdown is unknown.
Toronto being the largest source of migrants to Windsor is hardly surprising, neither is Leamington CA, Chatham-Kent or London. Calgary being the 6th highest could be an indication of a return lost sons and daughter from the oil sands.
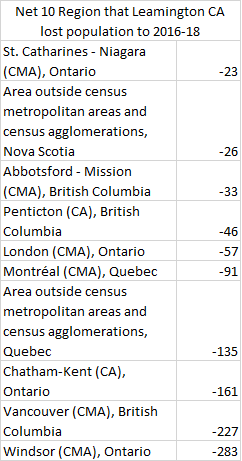
As for those leaving Windsor, it isn’t surprise that large urban centres (Toronto, Calgary, Montreal Vancouver etc.) are attractive outward migration points. If there is a surprise, Vancouver to me is one, as the cost of living jump between Windsor CMA and that metro is possibly one of the largest in Canada. Overall the Windsor CMA gained 15,610 people from other parts of Canada compared to losing 13,121 people between 2016-18. This brings us to the question, from where and which cities drove this change?
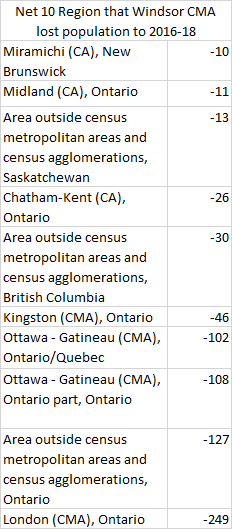
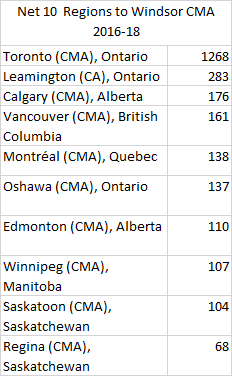
The net results do shake things up a little with London being the largest net population taker from Windsor. I honestly don’t know what’s going on with Miramichi and Midland as elements of family ties, niche employment or wanting to be on the water may have something to do with it. As for those coming to Windsor, we are pulling people from largest communities for the most part so our cost of living could be a driving factor.
As for the Leamington CA many of the same trends hold true.
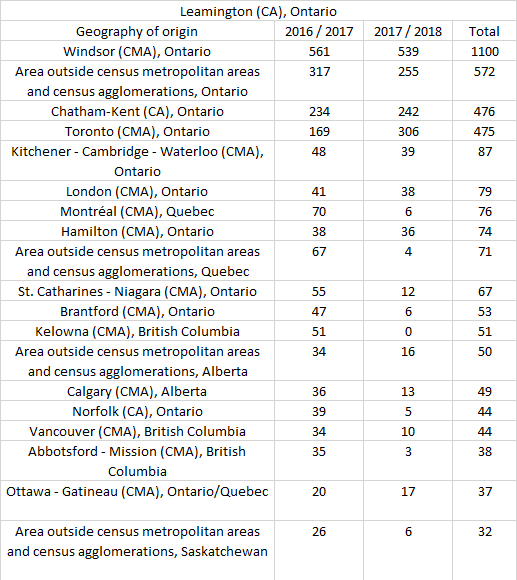
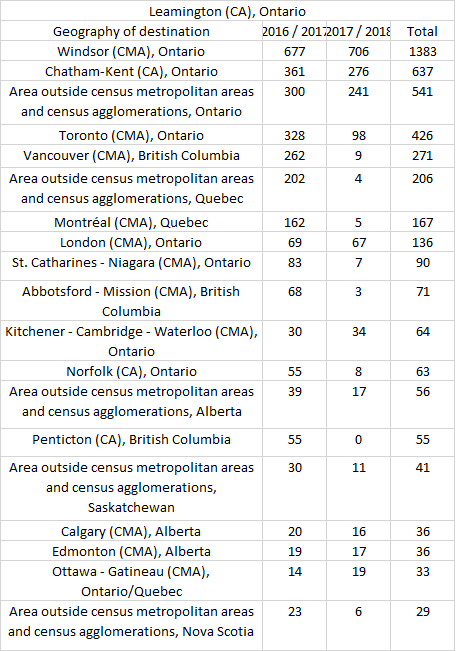
For both people arriving and leaving, Windsor, Chatham, rural Ontario (Essex) and Toronto lead the way as destinations and origins of people for the Leamington/Kingville areas. One clear piece of information is that the number of people who left the Leamington CA to other parts of Canada dropped significantly in 2017/18 with only about 1700 people leaving vs 3,200 in 2016/17.
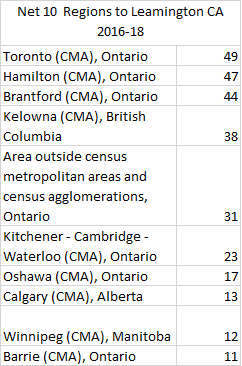
Leamington seems to be pulling small numbers from the the GTA or surrounding communities (Brantford, Oshawa). Again, surprisingly BC seems to be a major draw from the Leamington CA which makes me wonder about a wine industry connection between Erie shores and BC producing areas.
Why does it matter?
Populations are growing, that’s good…. or is it???
For the most part, yes it is, but as most things, its not that simple. The type and from where this population growth is coming from can pose challenges, the obvious one is the impact on housing prices. More hidden away, population growth has impacts on things like provincial funding formulas for health care, municipal services – the fast you grow, the more money you receive (in very simplistic terms). It isn’t a question of how fast you grow, it is how fast are you growing in comparison to other municipalities and regions.
Since 2010, it is estimated that on net, about 36,000 have came to Essex County, 46% of that total were net-temporary residents – migrant workers or international students. The challenge is we don’t know what our capture rate was for these temporary residents. If you were to remove these temporary resident, in that they don’t stay here permanently, Windsor and Essex County’s growth becomes far less robust. Additionally the constant churn that maybe occurring within those numbers bring added complexity.
As the population continues to age, immigration will drive population growth in our country, province and region. By the 2030, deaths rates are expected to surpass birth rates as boomers begin to die off (Okay Boomer!). As a result programs like the proposed municipal immigration program which would allow municipalities to be apart of the immigration process by nominating people to come to their communities, are becoming increasingly important.
For a long time, Windsor-Essex hasn’t been a place that people left, that appears to be changing. The question is, what are we changing too and are we adequately preparing to support that change?
