The Capital budget is a complicated beast as it has grown from 7 to 8 years this year and will grow to 9 years in 2021. What I have done is highlight a few projects that caught my eye, as well as compared the 2019 budget to the 2020 and see if new money appeared or disappeared. I have also managed to convert the PDFs that tables have been published into Excel files for both the 2019 and 2020 capital budgets some comparisons to be made. It is likely that I will continue to post about these comparisons after the budget is completed next week.
Inflationary Change?
One general comment is that there has been year to year changes in some project budget lines but whether that is inflationary growth is unclear. For example Cabana Road Improvements (ECP-003-09) for the 2020 year in the 2019 budget was $5.995M in the 2020 budget it is valued at $6.163M; 2021 $6.057M (in 2019) vs $6.056 (in 2020); 2022 $4.545 (in 2019) vs $6.045 (in 2020). It isn’t really clear why the shifts in costs (particularly in 2022) occur as there is no additional increases for 2023-2025 years when comparing 2019 to 2020.
Another high profile project is the Riverside Vista Improvement (ECP-016-07) which in the 2019 budget projected $1,040M 2020, $250 2021; $1M in 2022 the $3.3M and $3.7M in 2023 and 24. In the 2020 budget we see $664,000 in 2020; $250,000 in 2021; $0 in both 2022 and 23; then starting on 2024 – $2.2M, $2.4M, $2.5M and $8M to 2027. In total approximately the approximate $66M listed in the 2020 budget is well under the $72M that was projected in 2019 with only $100K being spent last year.
A number of lines in the budget have been tweaked or augmented for asset management reasons. Whether park benches and trails, traffic signals, tree maintenance and roads these all need to be maintained and the asset management plan lays out the road map for it. The 1.6% tax increase to meet these asset management needs are baked into this budget. As a result many 2019 budget lines that were sparsely to not funded now have steady funding streams which is a very good thing!
Many other projects that were listed year to year don’t change in their spending amount. It is unclear to me why some shifts are occurring and the short description don’t necessarily always provide sufficient detail. It is likely that there are broader supplementary reports or other council items that triggered these shifts. Given that inflation is a fact of life, I honestly don’t see it in many of the budget lines.
Projects of Interest
Issue number OPS-001-07 sees over $112 million on “various roads projects” which averages $16 million per year over the course of this budget document. This is being supported as a part of the Asset Management strategy.
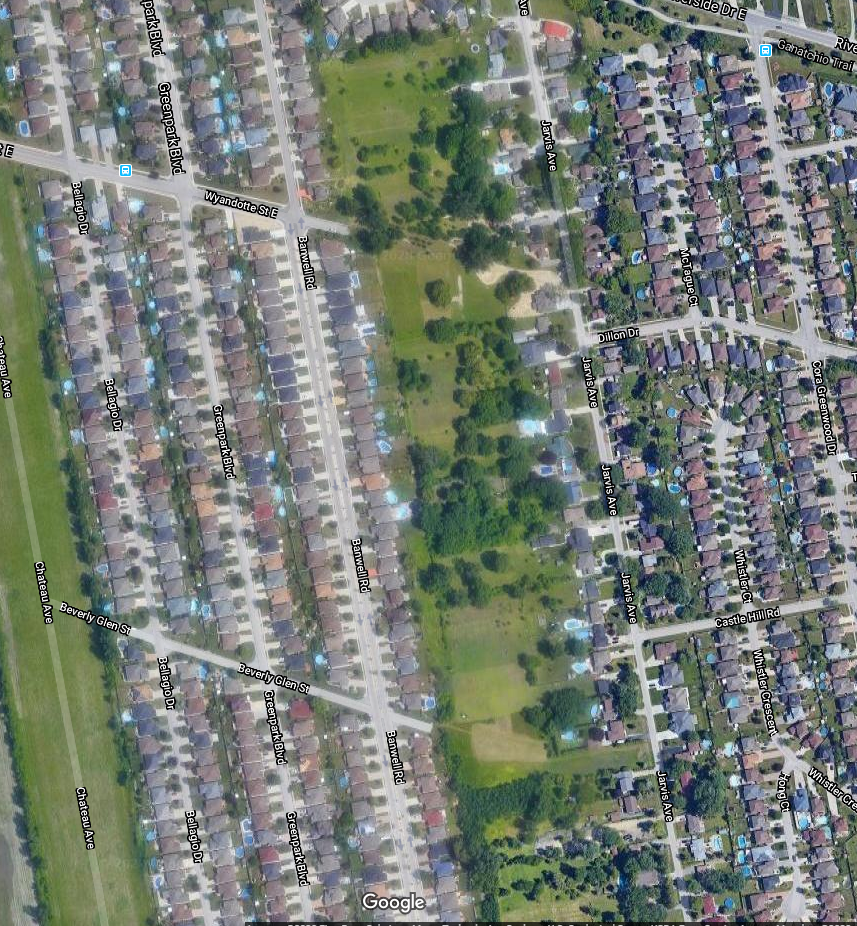
The East Riverside Planning District Infrastructure Improvements (ECP-010-07) at $2.4M it is the second most individually expensive road project to occur in 2020 (after Cabana Rd.). Originally approved in 2004, this project will prime 600 acres of land with the infrastructure to fill in the lands between Banwell and Jarvis with new housing in Ward 7. To be honest this reminds me the South Cameron Woodlot development discussion without the provincial significant wetland designation.
Starting in 2021 it looks like Municipal Organic Waste collection (OPS-006-19) will be on the agenda with $185,000 spent over the subsequent two years.
Pedestrian Safety improvements around schools and bus stops has $100,000 set aside every two years (ECP-008-07).
Construction of a Civic Plaza Linking to Enhanced Riverfront Parks System – Connecting People/Places (PFO-011-20) is the largest Parks and Rec expenditure over the 8 year budget at just over $20,000,000
New Central Library Branch (ENG-011-20) comes in post 2028 at $41,500,000 with construction estimated to begin in 2024. I am not sure how they are placeholding the money after 2028 with an earlier construction date.
Official Plan Review (PBG-001-18) will be coming post 2028 at $800,000
Geothermal/High Efficiency Heating and Cooling Systems (FIN-003-18) for a number of City facilities is holding $1M post 2028.
Breaking Down Capital Expenditures
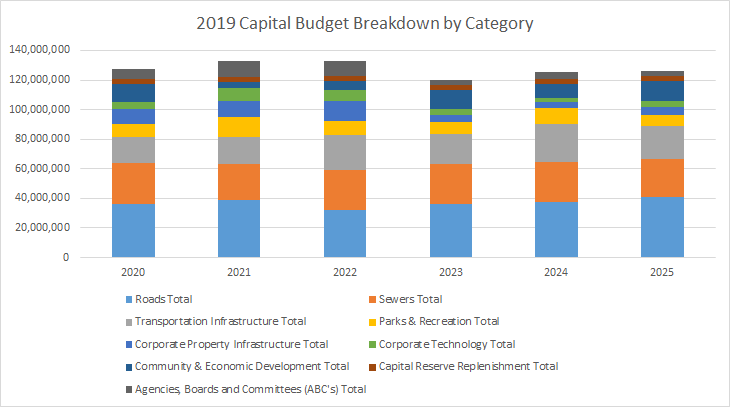
So when we add it all together what do the expenditures look like. You can find the total used to calculate these values in this excel file for download. Below you see the projections from the 2019 capital budget. This was a 6 year budget projection and I didn’t show the 2019 budget that has already been implemented.
Below is the 2020 Budget and the projections. The biggest difference is the $20+M jump in the amount being projected. This is likely due to the Asset Management plan and trying to get the unfunded liabilities of the City’s infrastructure under control.
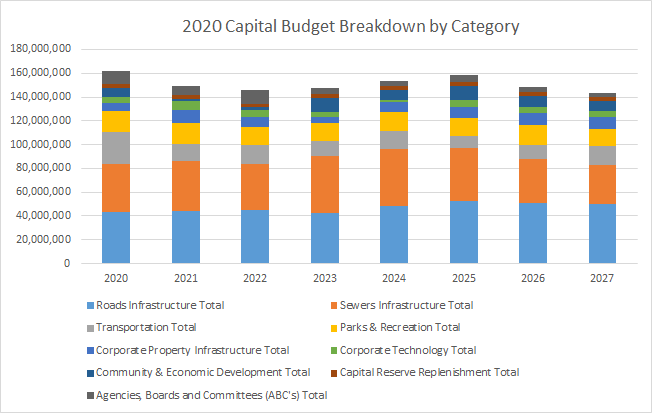
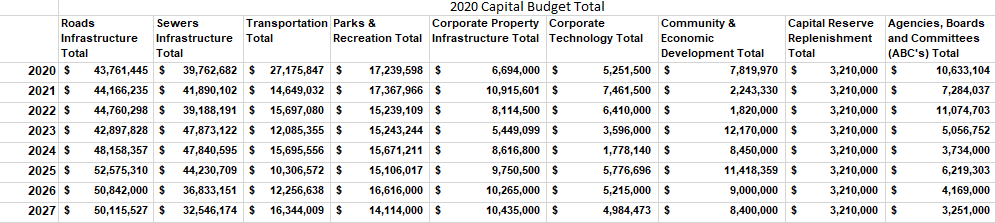
To illustrate the 2020 budget another way:
I don’t think it is a surprise that the vast majority of the budget is spent on roads and sewers. There may very well be some projects that people would prioritize differently or want their street done first but lets be honest, between the road conditions and the flooding in the City these are good investments.
The other transportation costs are largely driven by transit funding ($27M & $14M), corporate fleet replacements ($14M & $9M), traffic signals/street light refurbishment, replacement or relocation ($13M and $4.6M) with cycling at $5M. The bulk of Parks and Rec funding focuses on playground replacement ($16M) tree maintenance ($16M) and pool refurbishments ($9M). The Civic plaza link represents the single largest expenditures at over $20M. Corporate Property includes the maintenance of city assets 400 City Hall, the Aquatic Centre capital repairs, Willstead manner, Huron Lodge, the Art Gallery all have some capital maintenance planned over the next 8 years. The largest item for Community & Economic Development is the payment of the City Portion of the Hospital plan, starting 2023 at $6.9M per year totaling $40M by 2028. Districting, City Branding, support for BIAs all appear in this budget and will be implemented in the coming years.
Active Transit in Windsor?
The tweet below caused a bit of a stir locally when I shared it as people wondered could something like this be calculated. The short answer is sort of…
There are two big challenges: first the budget in many cases doesn’t breakout cycling infrastructure or specific project elements from road projects costs. For example the Cabana Road projects (valued this year at $6.13M) does not breakout the cost to paint the bike lanes on the road which is apart of this project. Whether that is sufficient cycling infrastructure is another debate entirely, the challenge is, we can quickly add up the costs of road projects but not extract from that value, potential cycling infrastructure. The Active Transit Master Plan does mention some roads that are listed in this budget (not necessarily this capital year) for repair or construction. Whether those project receive active transit infrastructure remains to be seen and I imagine the role of the recommended Active Transit Coordinator and specific Councillors is to ensure that work is accomplished.
The second challenge is within many of the departments categories in the capital budget are items that don’t cleanly match up. An example is under the “Road section” an item called “railway lands fencing” is listed (OPS-005-07) with $75,000 being spent this year. From the description this is money to maintain fences along railways near roads to prevent trespassing. Is that really a road network improvement or just something being done by a department and should it be counted in this calculation? Is Alley lighting a road project, a pedestrian safety project or an active transit one? Within the budget, there are a number of lines where projects, reports or back-end services that the public will never see or be impacted by are included in certain departmental categories.
What this means is that an estimate can be crafted but it likely will under value active transit measures and overvalue road or other transport areas. So what have I included in this calculation? First I created five categories:
- Named Road Projects – where the budget says X Road is to be invested in during a particular year. Specific projects like Cabana Rd or Ypres Blvd. – Forest to Walker – Mill and Pave to County 42 and Lauzon Parkway improvements are included in this category.
- Unnamed or General Road – things like city wide bridge repairs and pothole fixing. The largest segment of this category is Road Rehabilitation – Various Locations Program at over $112M over the course of the budget;
- Transit – New buses to bus stop amenities, to expanding maintenance of existing fleets;
- Pedestrian and Traffic Calming – Sidewalk repair/expansions, “traffic calming initiatives ” to street/alley lighting;
- Cycling Infrastructure – Explicate cycling investments
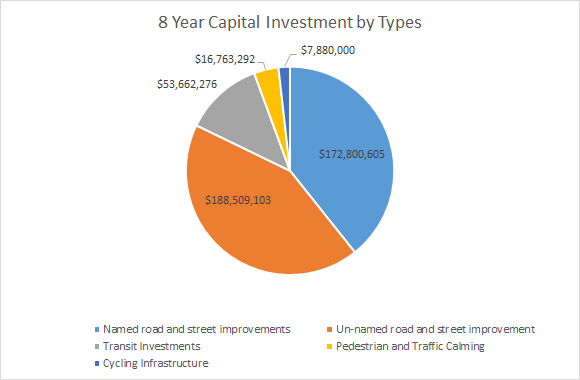
As I stated above, this chart overvalues road projects and undervalues cycling and pedestrian projects. I say this because when a road is being reconstructed; new sidewalks are included. In theory having new sidewalks that are smooth and level will make walking more comfortable, easier and more accessible. Unfortunately the cost of the pedestrian piece of that project is not accessible.
Conclusion
My overall assessment of the budget if summed up is one of “steady as she goes”. The asset management plan, see significant investment in maintaining assets that in previous years were unfunded. Lots of money is being spent on infrastructure which will make for a messy construction season for years to come.
If something is missing it is lack of forward thinking pre-investment. No money for new housing units is being set aside, little funding for explicate climate change initiatives outside of infrastructure improvements, arguably low levels of cycling investment. The word poverty appears once in the operational budget and not at all in the capital budget in my searches.
As budget cuts to lower tax impacts tend to come out of the operational side the capital budget will like move forwards with only some minor re-prioritization unless council wishes to increase taxes or take on debt. As this is the first true budget of this Council, it will be the one that frames the rest of the term in my opinion.

Pingback: A Few Thoughts on the City Budget 2021 | gingerpolitics
Pingback: Windsor Budget – 2022 | gingerpolitics