Where are People in Windsor-Essex?
As was mentioned earlier in a previous post, there is a lack of literature on mid-size Canadian cities and urban/sprawl issues which creates challenges in finding comparative context for our community. The vast majority of literature, research and best practices on sprawl focus on large urban centres. Large cities are home to the most acute cases of sprawl that present symptoms so severe that research has focused on solutions to the problems and individuals are willing to pay a price for greater convenience/lifestyle. Due to the lack literature on small and medium sized communities (of which Windsor-Essex is one) it limits the ability to accurately measure the impacts and consequences of outward growth in these communities.
That being said some research has emerged, with a professor from Queens University presented at 2017 Canadian Council of Urbanism Conference showed how mid-size urban centres in Ontario are transforming. Between 2006-11, urban cores of mid-size centres in Ontario shrunk by just under 10% while “auto suburbs” saw population growth nearing 90%, “exurban areas” growing by nearly 15%. The mid-belt “transit suburbs” only growing just by 5% with the technical definitions of each of these area being found in the report linked above. Over the same period, in large CMAs urban areas cores grew 6% while featuring significantly less suburban and exurban growth. Although there are comparative challenges in drawing conclusions between various mid-size urban centres due to their particular circumstance, the broader trend illustrated is clear, mid-sized urban cores face significant challenges in Ontario.
Gordon produced an updated paper with 2016 Census data in August of 2018. Looking at the Windsor CMA (this includes Amherstburg, Lakeshore, Lasalle and Tecumseh) we find:

The conclusions that are drawn from Gordon’s report show the uphill challenge faced by mid-sized urban areas across the country in revitalizing their centres. Although from his analysis based on Census Tracts some quibbling could be made around which tracts fall into what category given local context. The ability to apply practices and policies to smaller communities that do not face the same overt costs and challenges of larger centres remains a significant barrier in attempting to revitalize the cores of those communities.
Windsor and broader Essex County as a whole, will never face the vast distances of traffic gridlock that the GTA endures. As a result we will never face the same social, physical or economic costs of the scale of sprawl which in turn makes justifying and financing infrastructure change or policy shifts that much more difficult. With a average commute time of 18.8 minutes and 80.8% of people commuting to work arriving in under 30 minutes, Windsor CMA has one of the shortest commutes in all of Canada, who is to say to people that they live too far away from a city centre or their place of work?
Flows
Windsor-Essex County has a population of 398,953 people, divided between 8 separate municipalities. From a scale standpoint, Windsor dominates the region with being home to 52% of the population, this municipal division is little more than an illusion of artificial (some might say tribal) boundaries. With a drive time of an hour or so you can reach almost any point in the region in a reasonable amount of time which in turn has enable people to move outward.
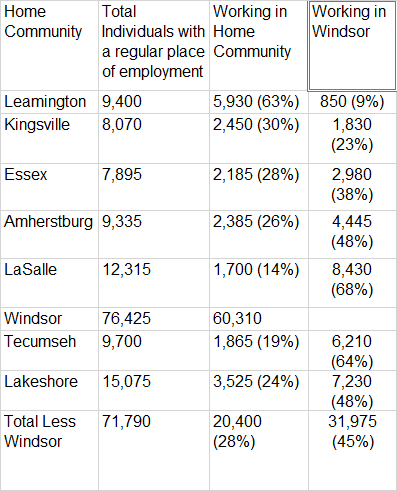
On a typical day 2/3 of worker living in the town of Tecumseh and LaSalle leave their communities and cross into Windsor; they are joined half of Amherstburg and Lakeshore workers. In other words the rest of CMA is largely just a housing many of the employees of Windsor. Essex is home to a slightly lower rate of commuting to Windsor with just over 1/3 of its working coming to the City. Tecumseh is Essex next largest employer and I would suspect that the Old Castle tool and die cluster being the primary draw down highway 3.
Kingsville and Leamington are the outliers in our region, as Leamington holds a significant portion of it’s working population within their municipality. This is likely due to its relative distance, larger size and limited access to Windsor that makes it more of an employment anchor. It is anchor facilities, like Erie Shores Health Care and the Greenhouse sector, which also enables it to attract approximately 1,800 people from Kingsville (about the same portion that commutes to Windsor from Kingsville) and about 1,000 from Chatham-Kent. The outstanding balance of the work force are employed in the other municipalities or across the border in Detroit. What is important to read in these numbers is the scope of the commuting into Windsor. There isn’t anything explicitly wrong with this migration as these flows of people are simply reacting to the perceived advantages of living in one community and working in another.
The Creative Class
Given these population flows the question that must be discussed is who is living where. Although not without controversy, Richard Florida’s research and views on the “Creative class” have embedded themselves in social political culture. The idea of the techy, hipster living downtown and revitalizing the community via trendy coffee shops and hip attractions/amenities is the vision for most urban downtowns. Although Florida’s own mec culpa recognizes and attempts to reconcile his brand of what I would call elitist urbanism with its impacts on existing populations. Drawing people downtown remains the focus of politicians, community groups and local champions in our region. Mark Boscariol and I had a number of conversations on how Windsor could attract people and students downtown as well as the potential trade-offs of that attraction. Having listened to RCP year in review show and having finished reaching Florida’s book for a second time, it got me thinking about Florida’s creative class, and Mark’s belief in downtown.
The question becomes who is living downtown and where is Windsor’s (Essex County) “creative class”? Florida generally defines the creative class as more education professionals who are responsible for the creation of intellectual property. The “creative class” (generally) are not those who create (physically build) the widget but rather those who design the widget. Unfortunately employment data that Florida has used to measure the creative class is not readily available for our region.
As a result I looked at 3 proxies. First, where do people with greater than a University degree reside in our region. This isn’t to say that a BA isn’t sufficient to be a member of the “creative class” (BA in Computer Science as an example) but unfortunately this is how census data is parceled. The two maps below show, by total number of individuals over the age of 15 who hold educational level greater than a bachelor degree by census DA.

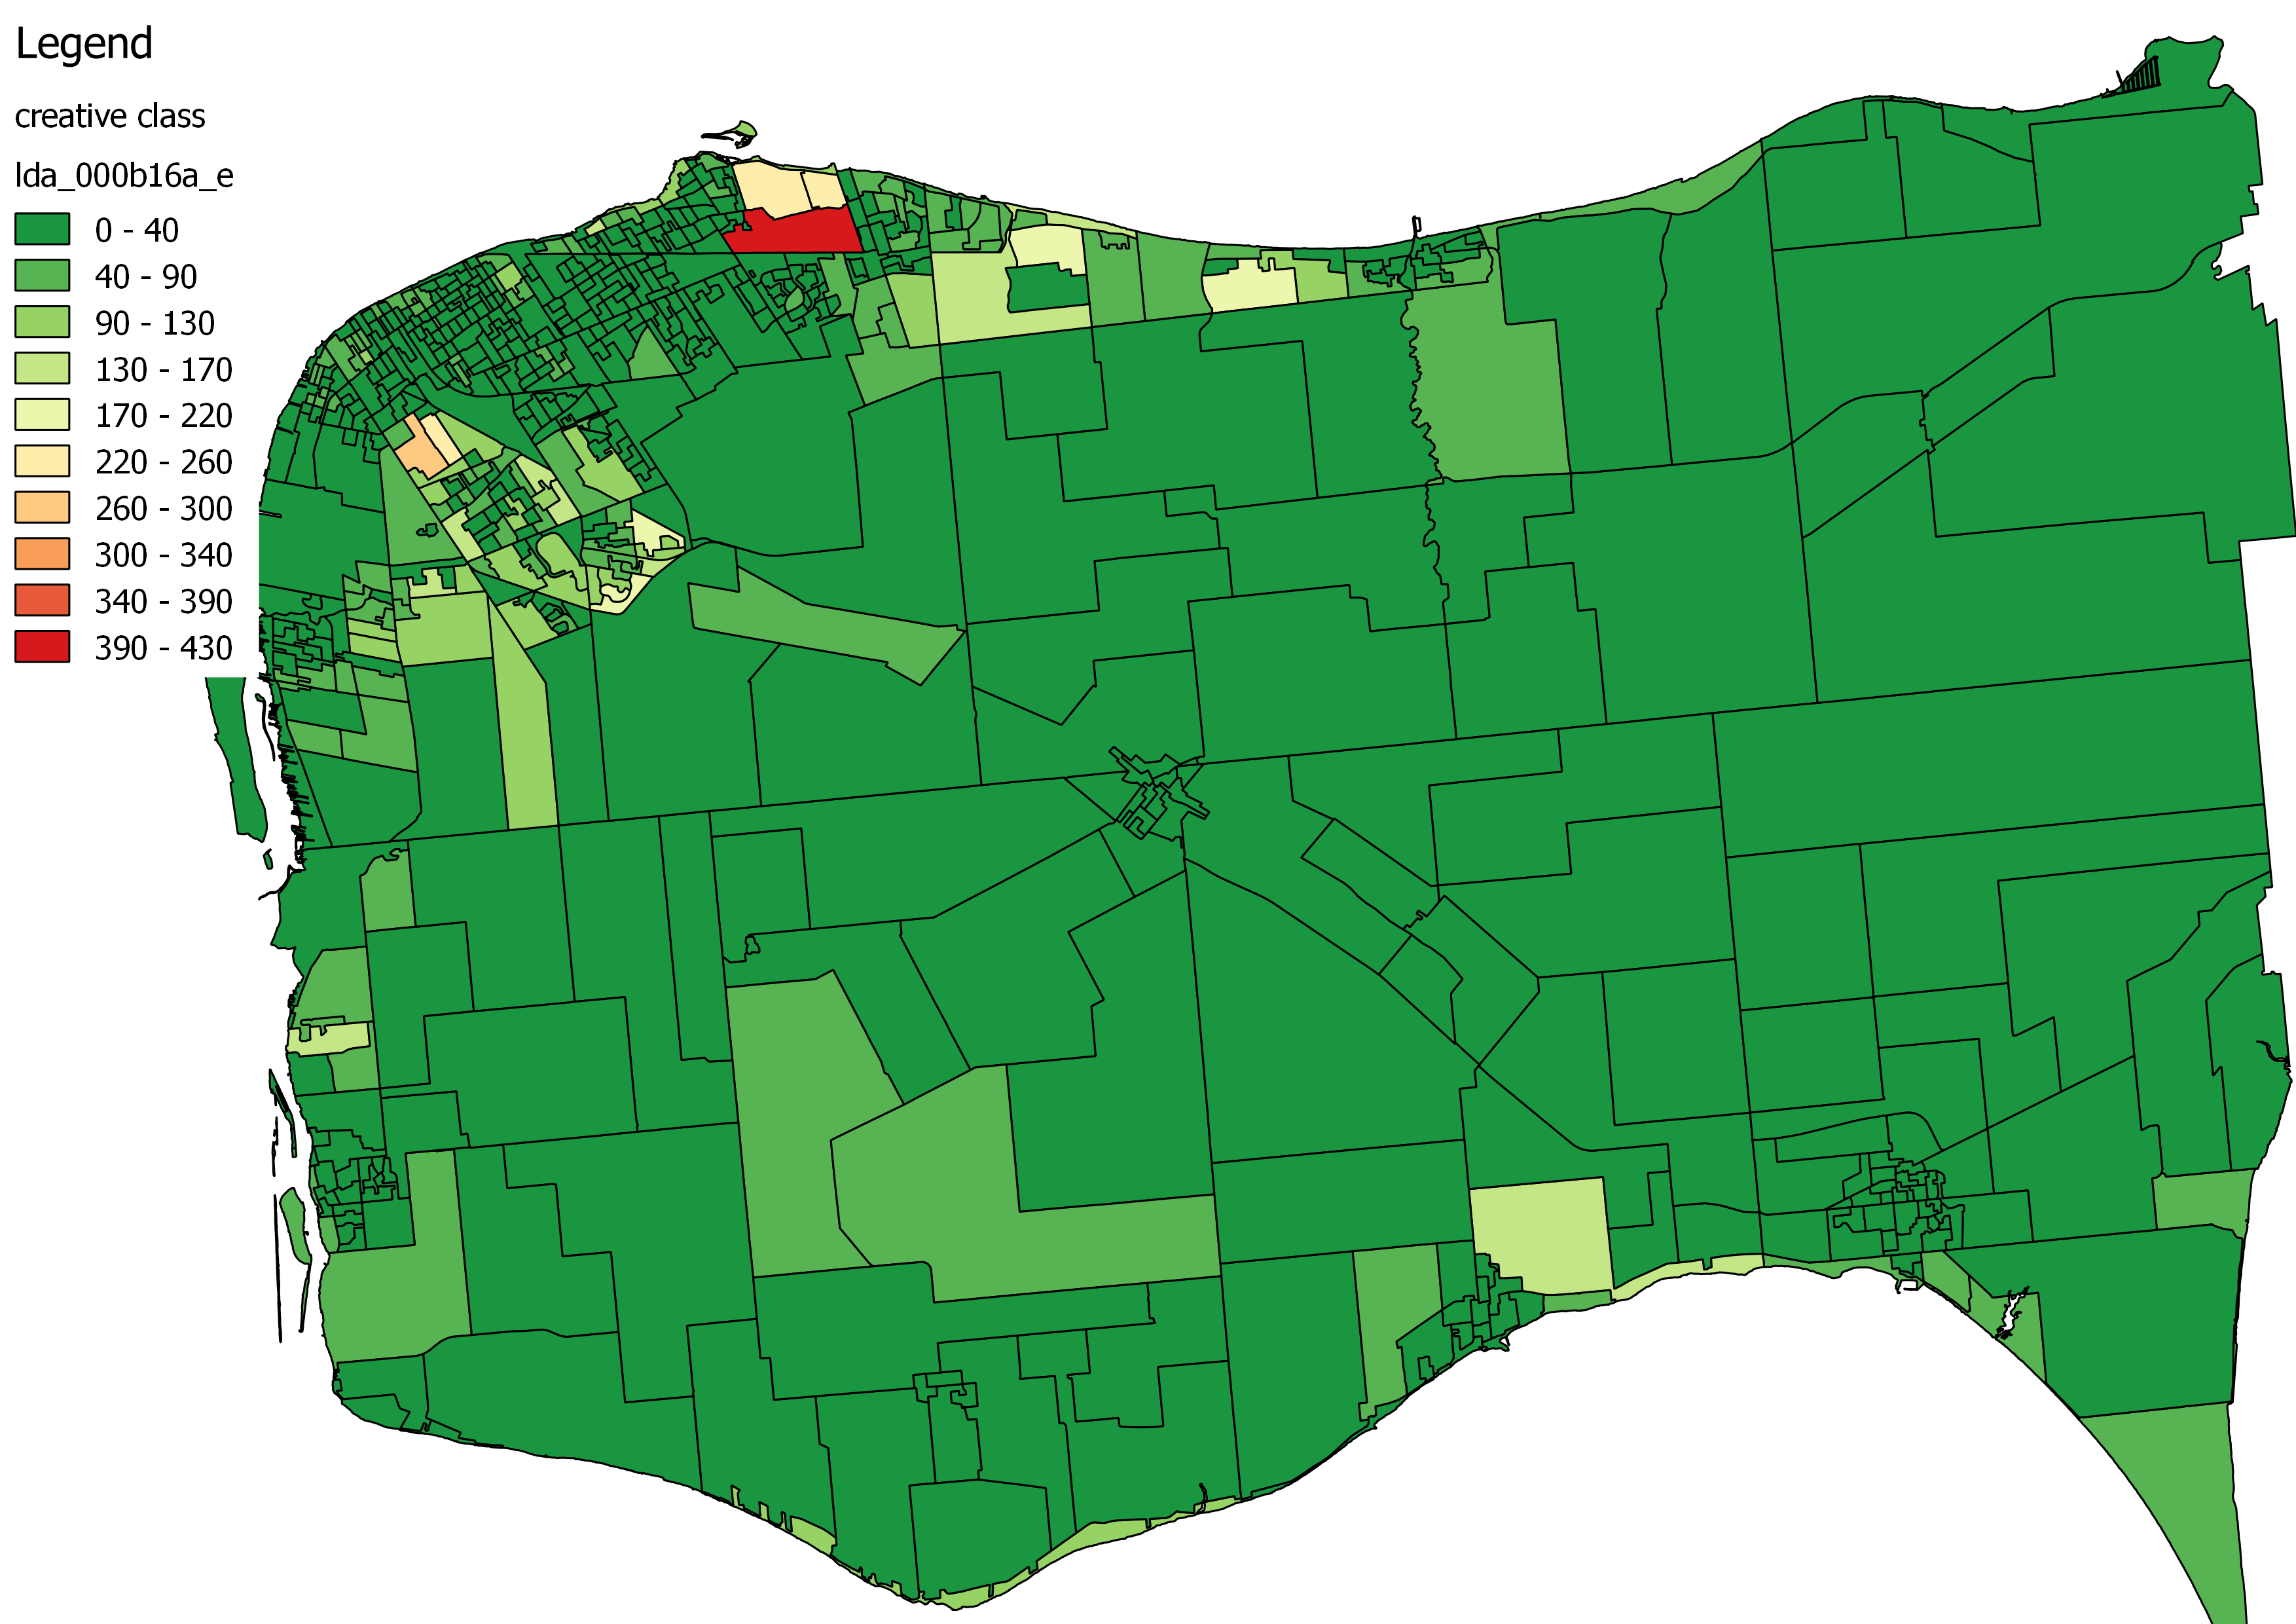
The map on the left shows the portion of the population with a degree above a BA while the map on the shows the total number of degree holders. Given that a post-graduate degree in our community is worth almost $17,000 per year compared to a BA in average wages ($98,700 vs $81,800) in the Windsor CMA. The presence of these concentrations of higher income degree holders creates an pockets of populations where needs are met, there is greater disposable income and in turn greater time to access community amenities and advocate for services. Unsurprisingly Old Walkerville and near the University are home to higher rates of post-graduate degrees (as a percentage) but from a raw number standpoint more live in Wards 1, 7 and 10 than the core (green map). These higher totals spill over into LaSalle and Lakeshore.
Another way to look at the data is by occupation area. Statistics Canada tracks ten occupation classification in public data: Management; Business, Finance and Administration; Natural and Applied Sciences; Health Occupations; Occupations in Education, Law, and Social, Community and Government; Occupations in Art, Culture, Recreation and Sport; Sales and Services; Trades, Transport and Equipment Operators; Natural Resource Extraction and Agriculture; and Occupations in Manufacturing and Utilities.
If we were to group these categories using Florida’s rough guidelines of creative vs non-creative employment sectors: we would find the first six categories (Management through Art, Culture and Rec.) generally aligning with the creative class and the last four generally do not.
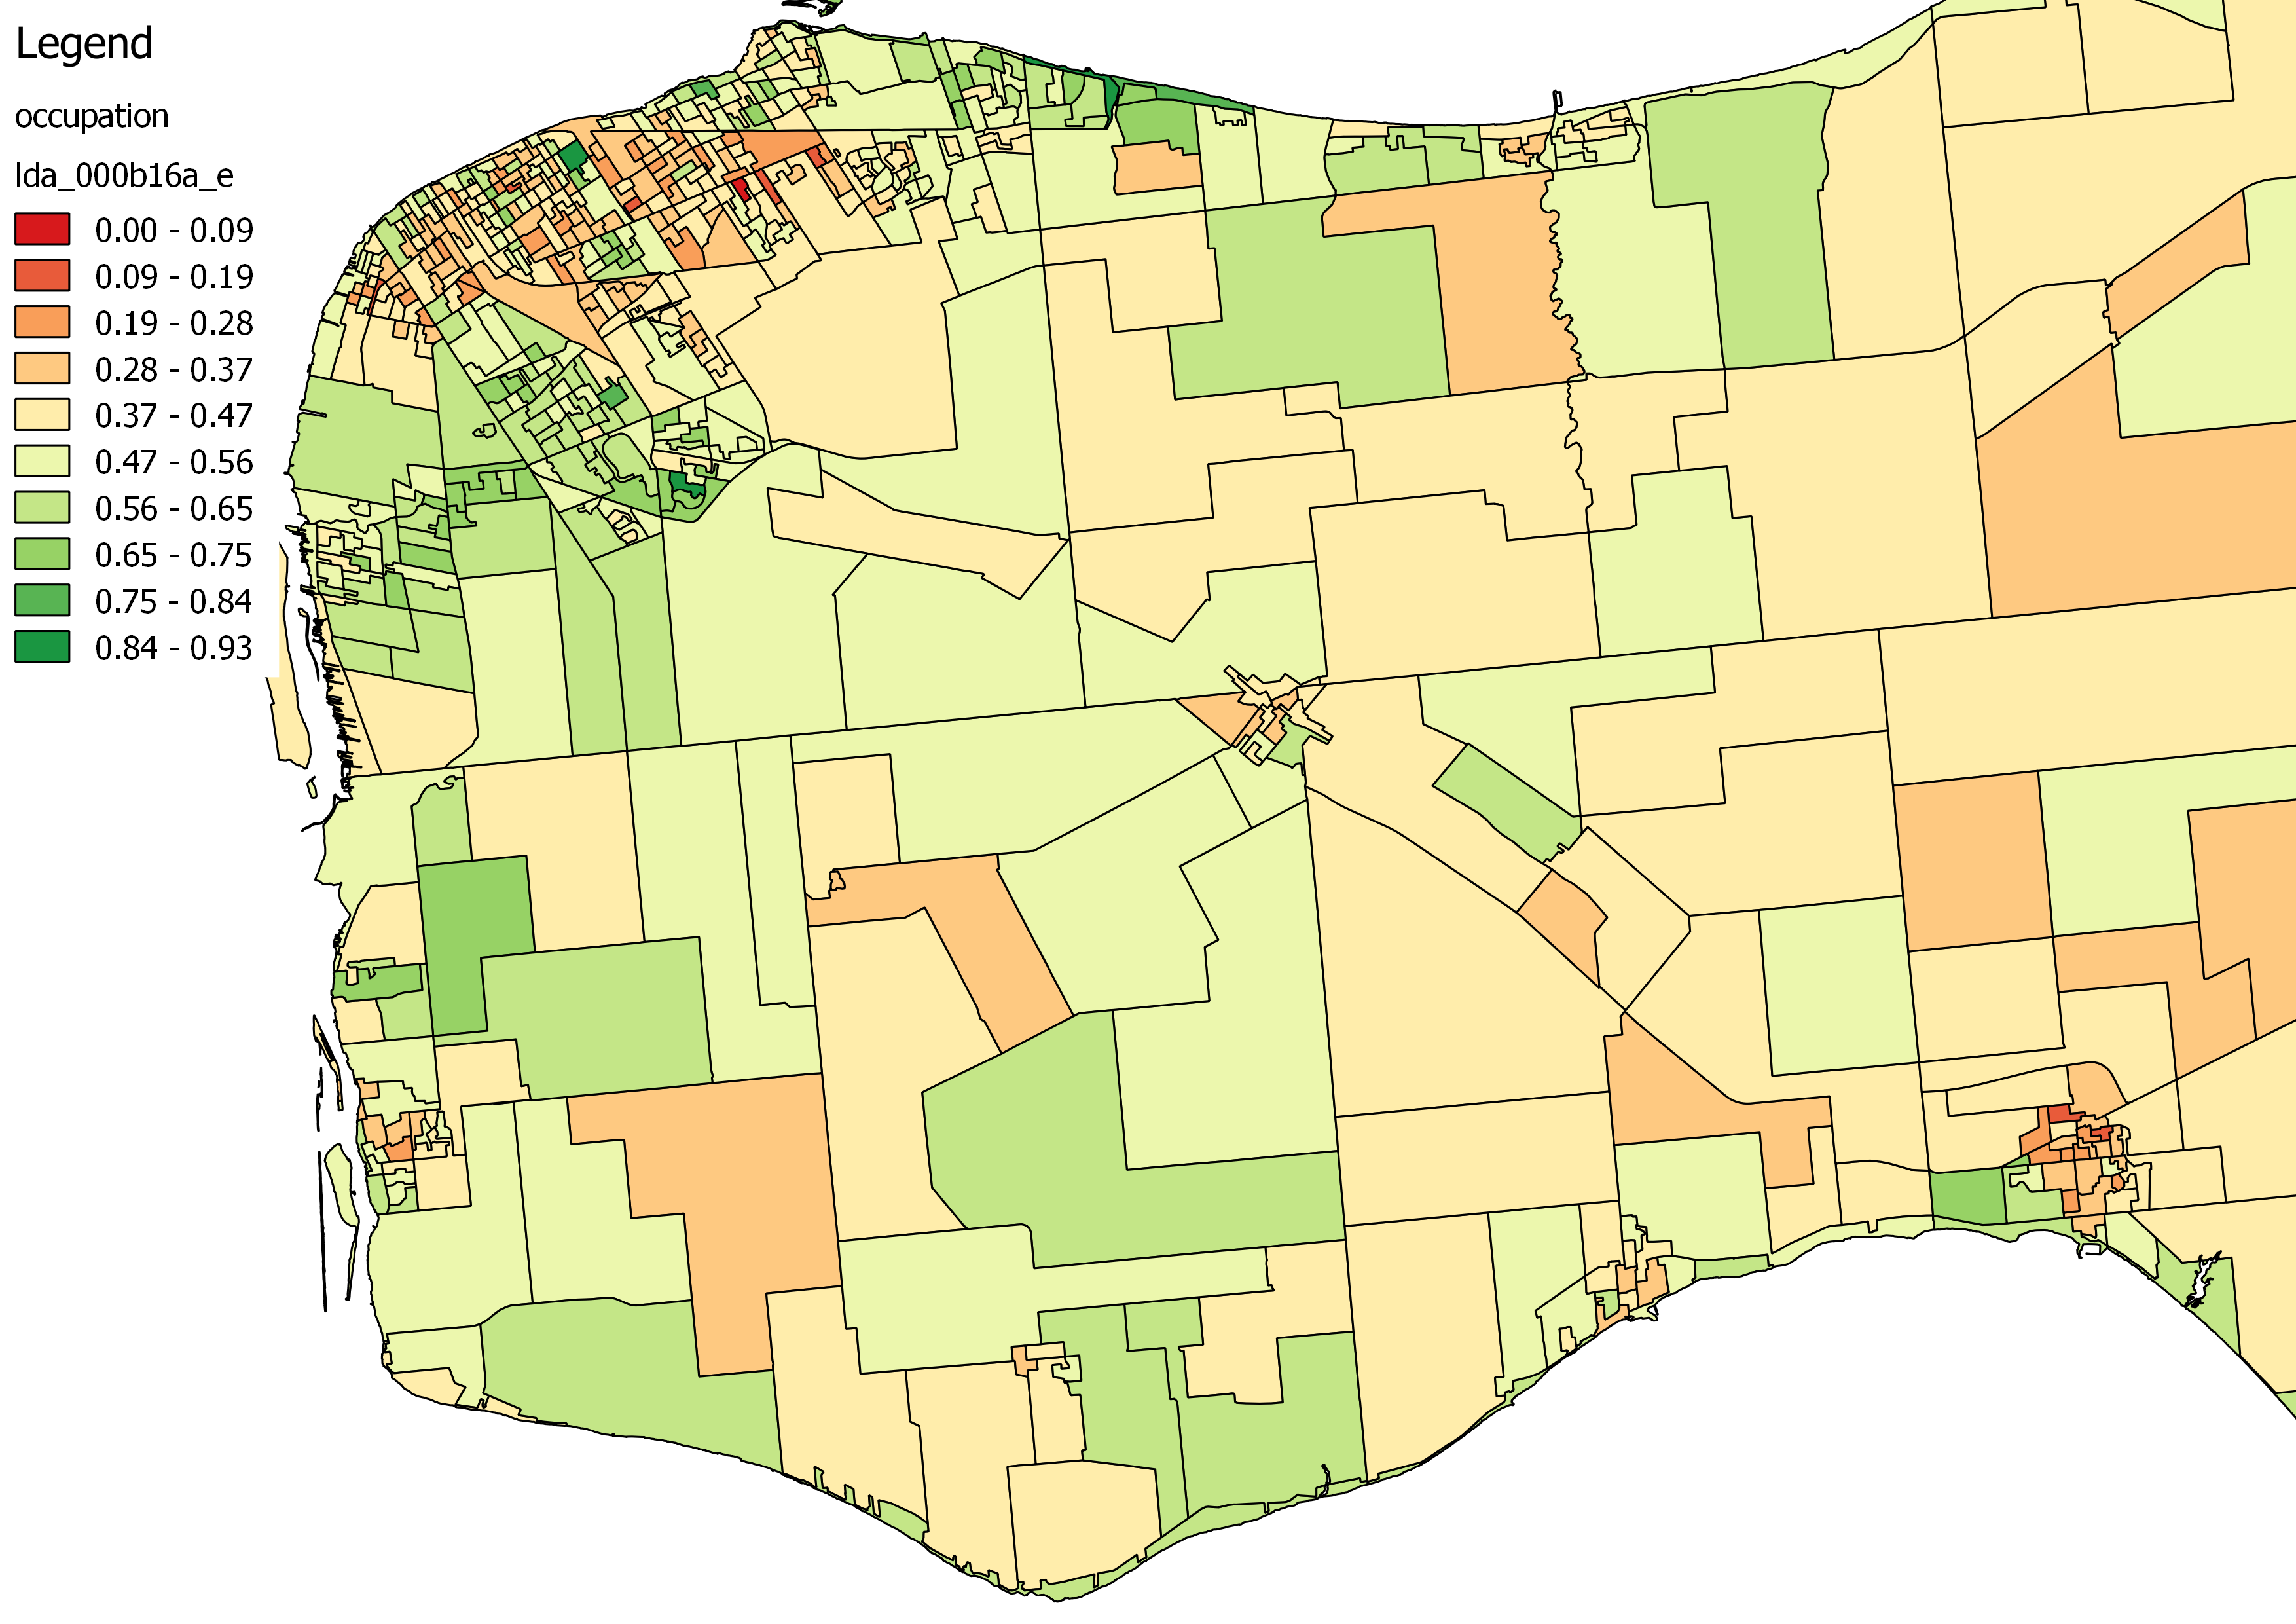
2016 Census based on NAICS Occupation Categories 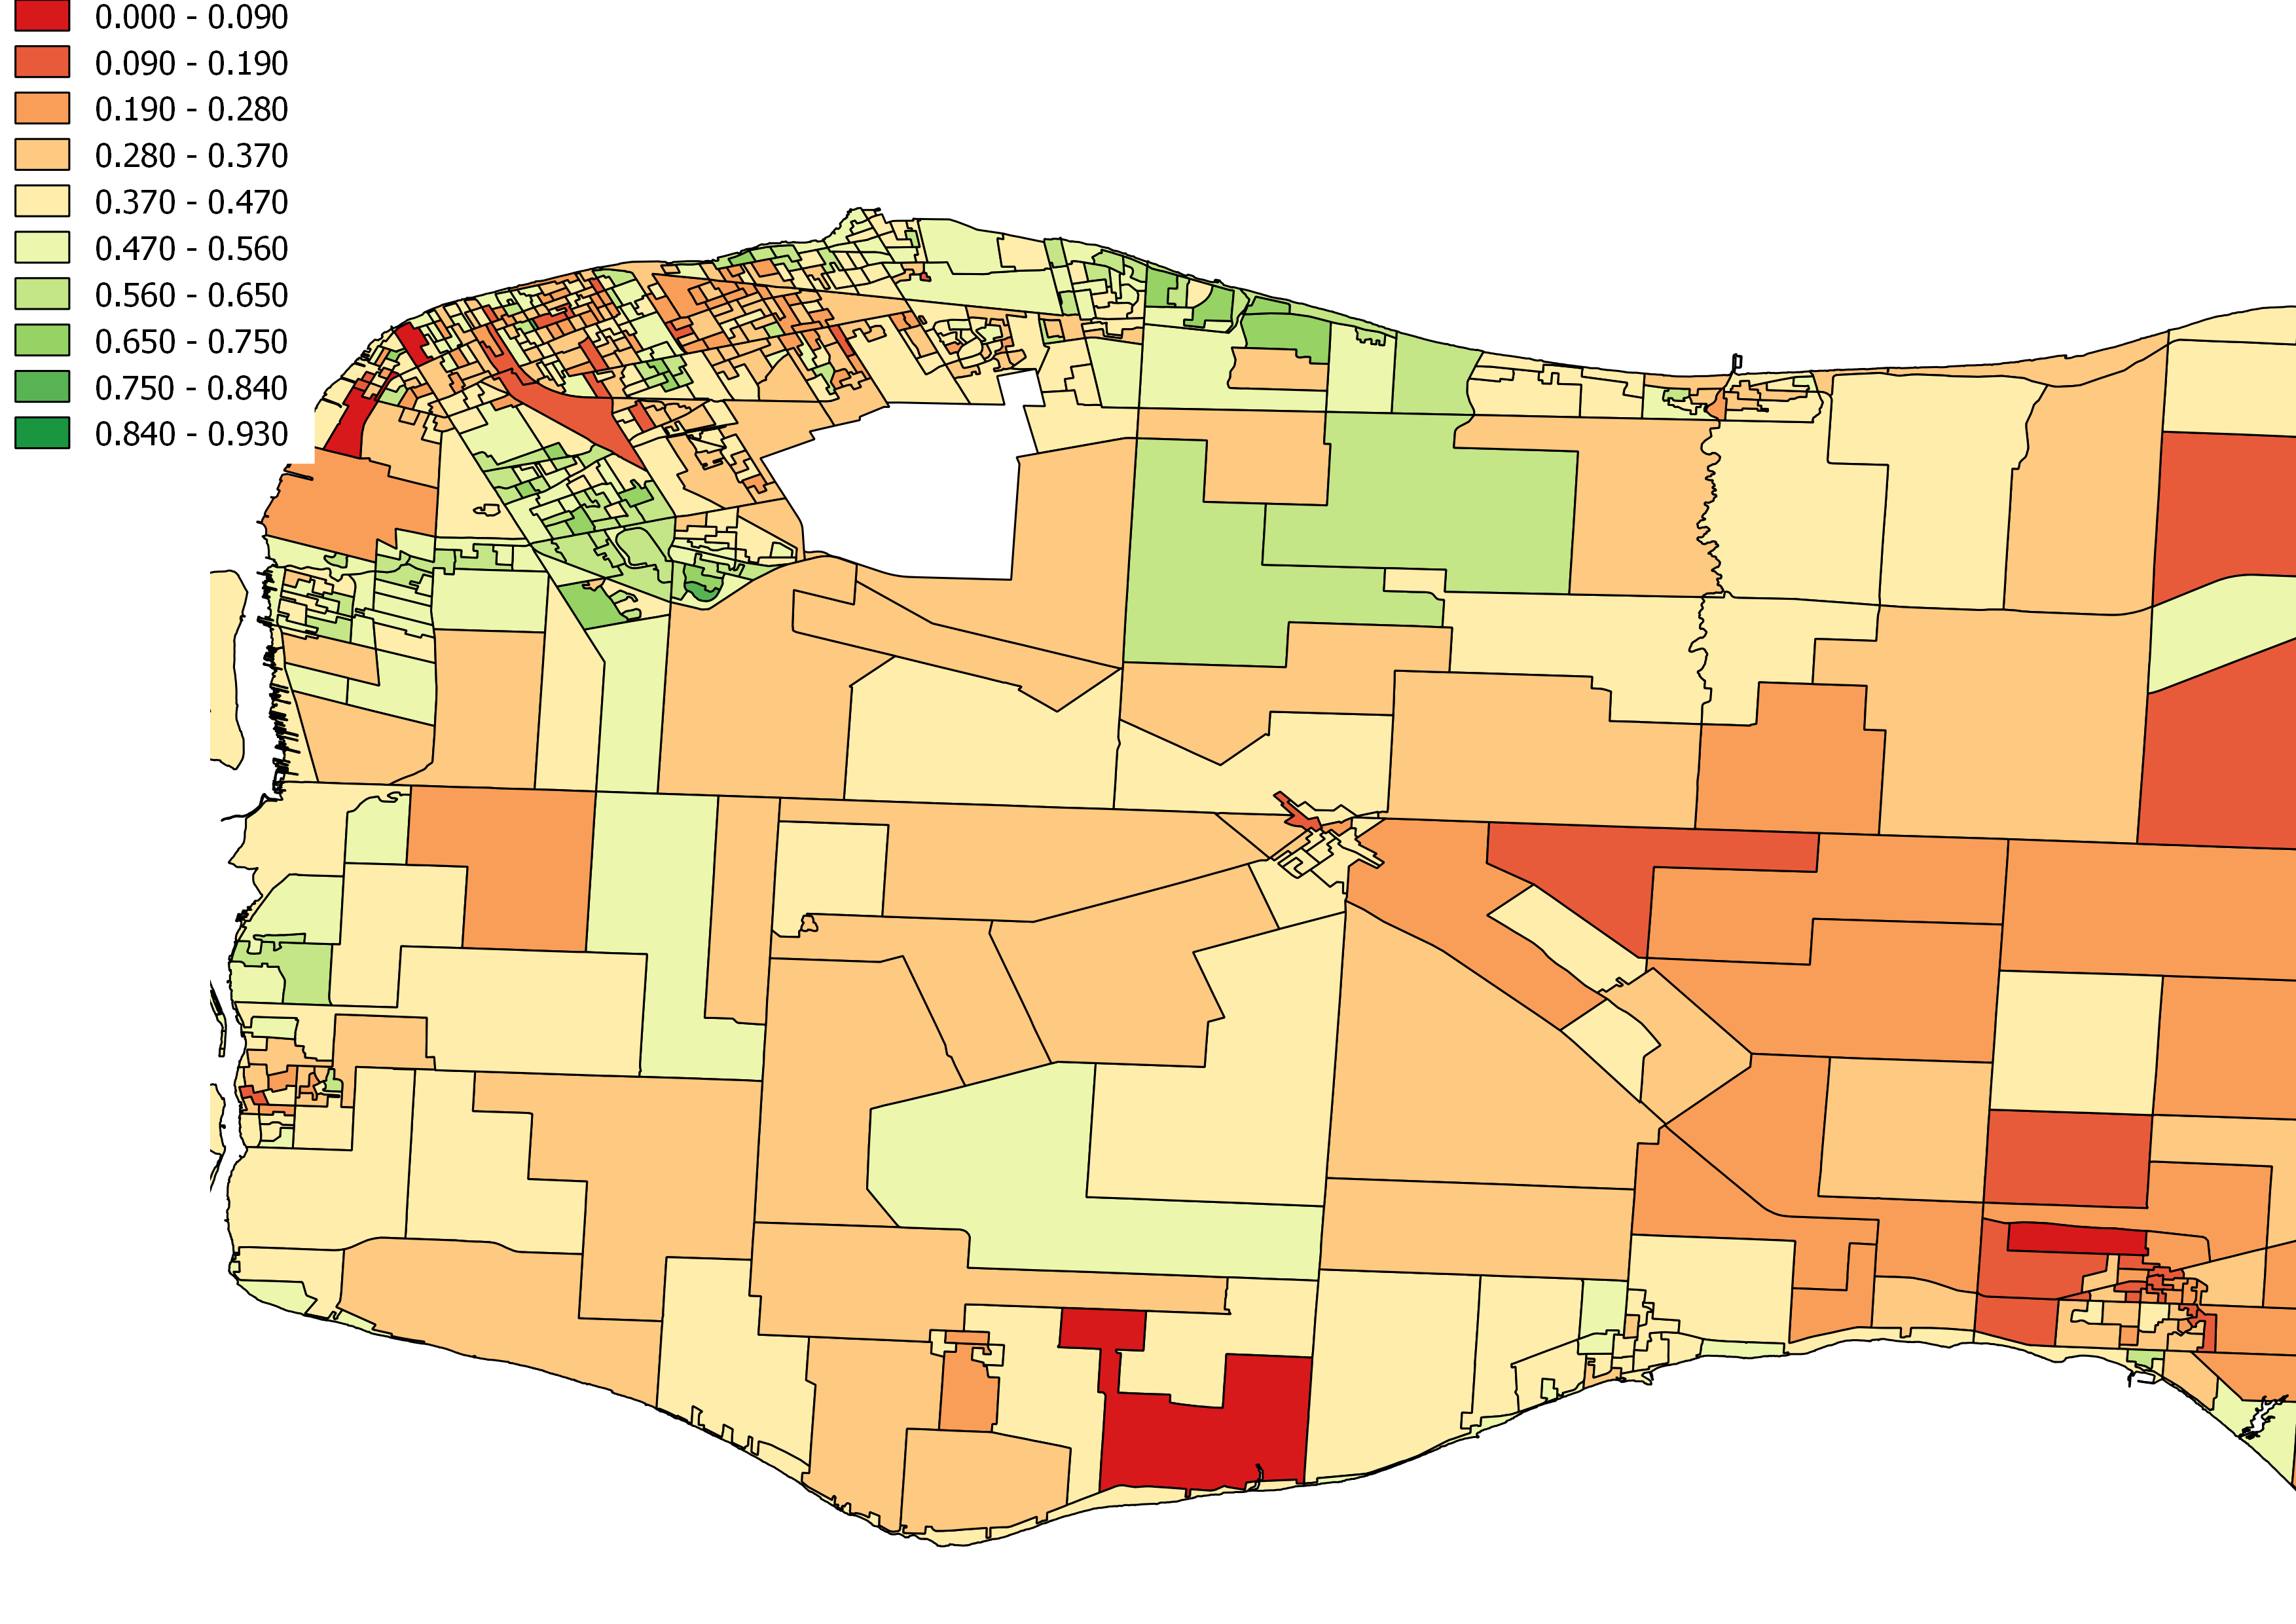
2006 Census baed on NAICS Occupation Categories
The map above illustrates percentage of population that reports being in the creative occupational categories. With a relatively strong correlation of 0.64 between the presence of a “creative” occupations and a rise in average income (median income scores 0.59). What is striking is when this is compared with 2006. When you compare the 2006 and the 2016 data (setting aside the shapefile differences creating distortion) you see dramatic shifts in our region. Part of this has to do with the changing nature of our economy through the Great Recession but when compared with other communities there is still work to be done.
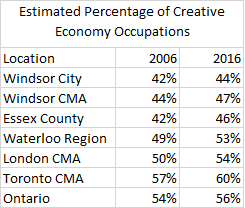
Beyond our region we find, that we lag our peer communities and competitors in the global talent races which of course has consequences for economic diversification.
A third measure of the “creative class” is by North American Industry Classification System (NAICS). Unfortunately at a sub-municipal level to ensure privacy of the responses only general industrial sectors (2 digit) are available. Given that there are 20 industrial codes compared to the 10 occupation codes it does allow for a more refined measure of types of jobs that are available. I divided the codes into two groups:
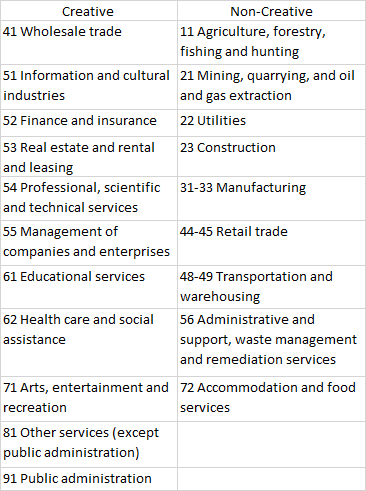
From these categories we find:
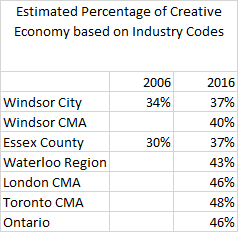
What can be taken way is that due to the greater precision of the 20 categories, the actual “creative” levels in our economy decline from the 10 occupational categories. Our region in 2016 still lags Provincial and peer communities.

2016 Creative by industrial code 
2006 Creative by industrial code
Within the mapping what we find is yet again an overall shift in the our region toward the more creative but where these people are living matters most. The biggest winners of the decade from a industry perspective were the suburban and semi-rural municipalities while core areas of Windsor (West Windsor, Wyandotte corridor) continued to struggle. Through a basic corollary analysis we find a weak negative correlation (-0.35) presences of the creative class employment and prevalence of low income. In other words, neighbourhoods with high rates of “creative” economy members, there tend to be lower rates of poverty.
The biggest taken away from this crude analysis of the “creative class” is that overall circumstance have improved but we are not catching up to the rest of the province. In an age of globalized work forces this puts our region at significant risk.
Density for Who?
Based on Florida’s arguments, the “Creative class” when in significant concentrations will drive urban revival. Growth of “creative” clustering outside of the city core has an important impact. From the Occupation data we find that in 2006, there is only 1 DA had greater than 75% concentration of creative employment, compared to 2016 Census DA with a 93%. In other words, the employment homogeneity of our neighbourhoods is shifting.
In 2006, only 16 DA in Essex County were home to greater than 2/3 of residents being in a creative occupation, in 2016 that is 44. Of those 44 DA, 21 reside in Windsor with only 5 being in the “Core”, 4 clustered around Walkerville and 1 closer to downtown. The remaining 16 are clustered in Ward 1 in and around Roseland; Old Riverside in Ward 6 and new developments in Ward 10. Contrary to Florida’s prediction, concentration of creative classes have not moved towards the city centre, demanding greater urban services. In fact in 2006, 11 of the 16 DAs with highest concentrations (66% or greater) were in Windsor, 4 in the core. Two of these DAs maintained their “creative” populations (Walkerville) while two lost populations, one near Ouellette Campus and one near the University in ward 2. In other words, there are more “creative” people in Windsor but they are not clustering in the core.
What we live in is a modest sized region that is then artificially divided into smaller governing units. It comes from these artificial divisions that a true debate of whether the sprawl like development occurring in our region and whether it has reached a point where actual measurable negative consequences can be found. Of course road traffic into Windsor from the surrounding communities carries a cost to the infrastructure of the City but those costs are unavoidable given the context and nature of the region. Even if Essex County was a single municipal government (like Chatham-Kent) those same costs would have had to have been bore and much of the development that has occurred would have likely occurred anyways and the fundamental nature of Windsor housing stock and layout would have still have encourage peripheral development.
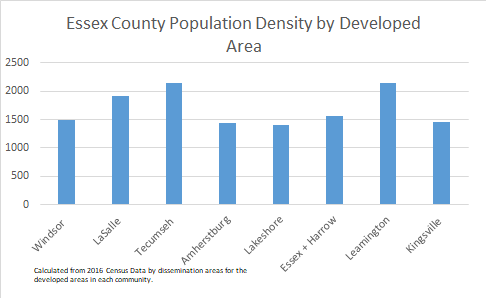
The above chart illustrates population density by municipality but it removes the vast tracks of rural areas surrounding their own urban areas. For each of the communities, these developed areas make up a clear majority of the municipal population and in many ways show how concentrated people are.
In many ways the smaller municipalities of Essex County are actually better placed to develop more compact, urban communities than Windsor is. When you look at 2016 population density data for the developed areas of each municipality you see that in many cases these communities are denser from a population standpoint then Windsor.
These comparable population densities actual give the small municipalities of Essex County a significant advantage when compared to Windsor. A single amenity (bike lane, library, community centre etc.) in these communities is a far more impact on quality of life and connectivity then in Windsor. Items like the redevelopment of Amherstburg downtown. improving Leamington Waterfront or a new bike lanes connecting communities will transform these communities while a major project like the Riverside visit project or Ouelette ave redevelopment are pieces of a much bigger puzzle.
Windsor for its part does have the economies of scale to take on more projects due to its larger tax base, but it is burdened with the costs of maintaining an aging infrastructure. Looking at the proposed and bold active transit strategy for the City of Windsor the the time frames involved (20+ years) to reach some of the targets, show the scope of the challenge as culture change takes time and decades of investment.
In the meantime people are voting with their feet and wallets. More affluent suburban communities are comparably dense to Windsor, are home to higher concentrations of community amenities and all within a drive that is one of the shortest in Canada to their job. Even within Windsor, the trade offs between tackling the needs and wants of our community are at odds. Home to one of the highest poverty rates in Canada we fret over bike lanes, give subsidies to developers to build unaffordable units downtown while not fundamentally investing solutions to some of the broader social challenges.
Although not entirely mutually exclusive, given the resources constraints of pending cuts at a provincial level, and a mantra fiscal responsibility at City Hall choices will have to be made and questions will have to be asked. A truly urban centre can be built, and it can be connected to surrounding neighbourhoods through innovative and active transit solutions. If we don’t solve some of the underlying social issues in those same areas will they actually attract the “creative” individuals and companies that we are hoping to attract when they can get an equivalent lifestyle with less hassle in another part of the region.

Whether those underlying social issues will be addressed in time is a good question. The pessimist in me thinks that as long as we (that is, the broader community that reflects political will) think more about traffic congestion (or relative lack thereof) rather than the cost of building and maintaining infrastructure when considering the subject of urban sprawl, we have little hope of getting it right.
Hmmm… I wonder if I can get a density map of Essex county to more accurately portray this.
Pingback: Windsor Research Project: Economic Transformation | gingerpolitics
Pingback: A Few Thoughts on 2021 | gingerpolitics
Pingback: A Few Mid-Week Thoughts – Economic Development | gingerpolitics