At the end of April the latest release of the 2021 Census data occurred. I have been pretty busy so this is a little delayed in being posted – The Windsor Star and other media outlets provided their cursory coverage of the release but there are some items that need unpacking.
Where are the kids?
As the article above states the number of kids living in Windsor Essex is up, but where those kids are is an important consideration.
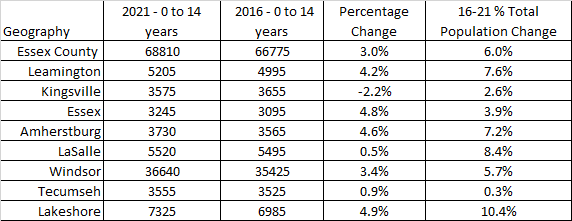
Despite the region growing the number of children by 3% that growth isn’t equal. As Mike Moffatt’s research on “driving until your qualify points” the region a has been a beneficiary of migration from more expensive parts of Ontario. Where these families set down roots likely points to a generational commitment. Given the state of the housing market, and the continued rise in prices, these families are not likely moving short of a major upheaval in the provincial economic system.
One interesting community to look at is LaSalle for example grew by almost 8.5% was practically flat in child population growth. This is likely boomers moving to the raised ranches and condo developments that were relatively inexpensive compared to other regions – despite being premium bedroom communities locally, a similar story in Kingsville.
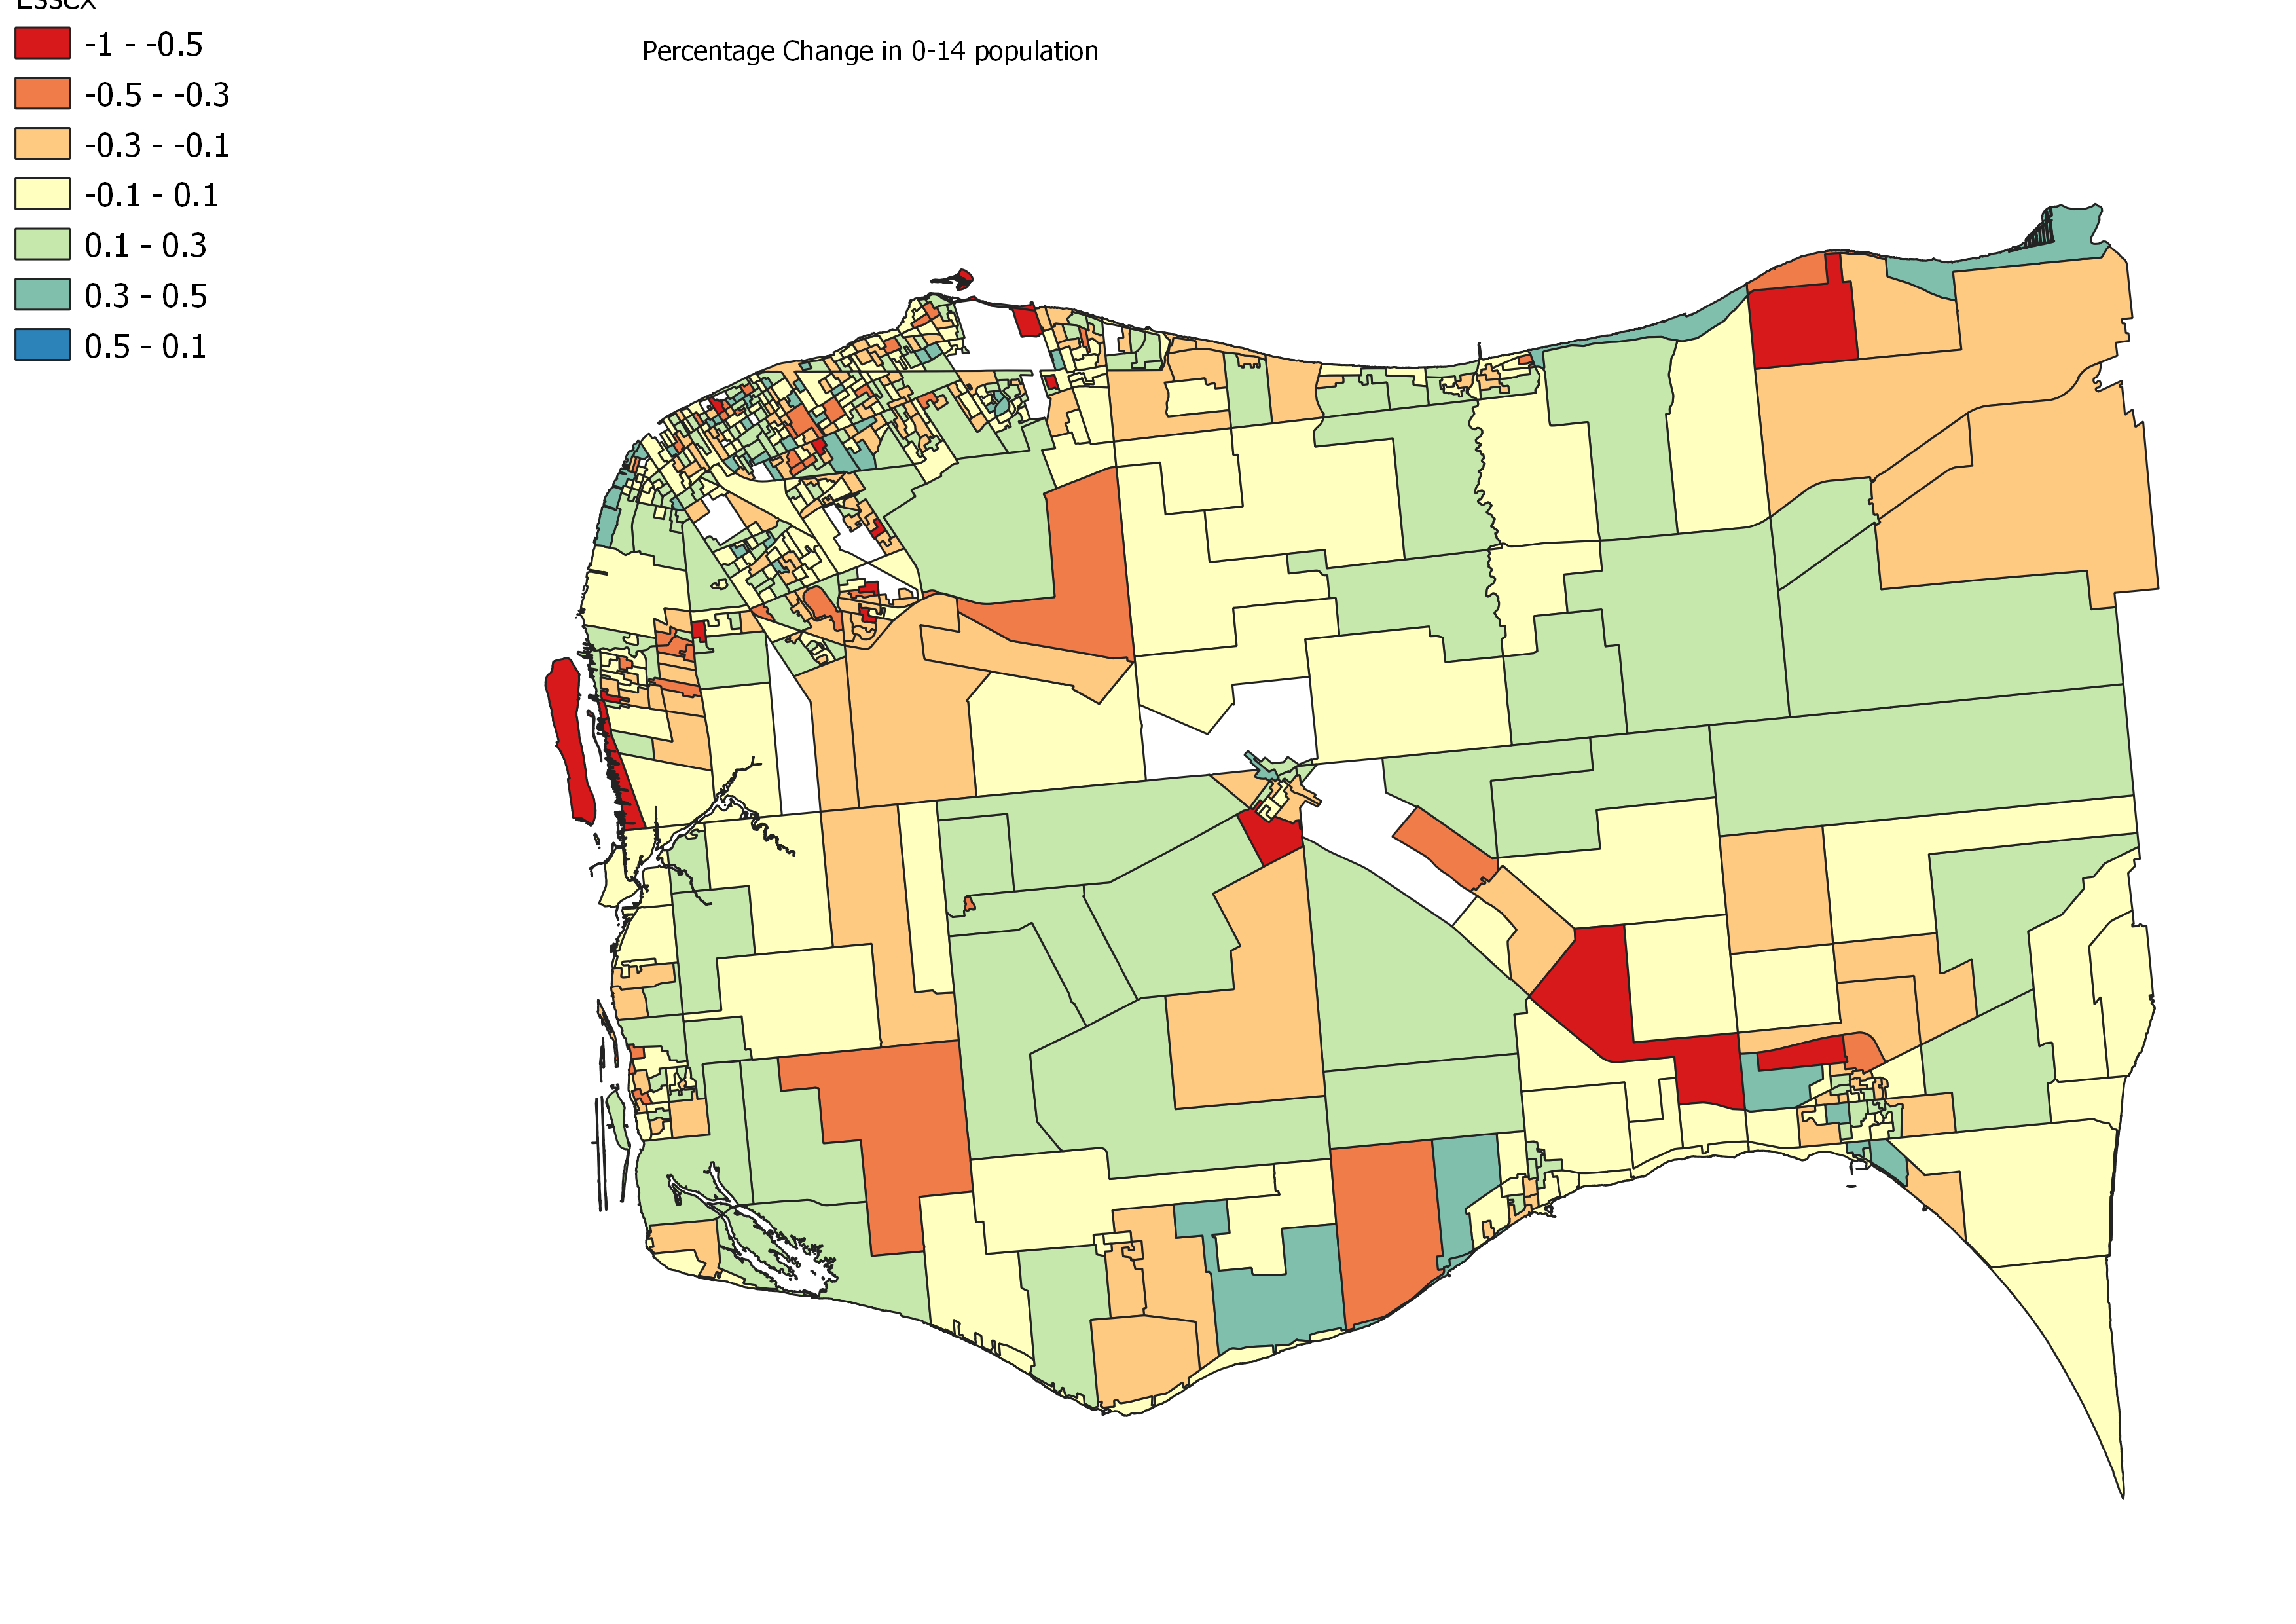
A quick notes about some of the gaps in the mapping. As I have talked about, there are some new DAs in Windsor which very difficult to accurate estimate overtime. Additional a few of the holes in the county are due to a 0 being the number of kids in their 2021 or 2016 Census. As #mathishard 0 in many equations lead an error when trying to calculate a percentage change.
A first takeaway is that if it is a yellow shade there really is no change in the number of kids. A +/-10% change in children equates to a 3-10 kid change in population. A few babies were born, a family moved in or out, a few kinds who were 10 in 2016 have now aged out of this demographic group. That summarizes the change in those areas.
Areas in Orange and Red are obviously where you see declines in child population. I find Lasalle interesting where generational turnover is occurring. LaSalle is quickly becoming a retirement community as young families can no longer afford it and the kids of the 1990s growth are now in post-secondary or beyond. In Windsor, southern parts of Walkerville sees a pretty consistent declines in kids. Also in South Windsor Roseland and Southwood Lakes and are all seeing a similar generational turnover.
On the flipside more kids in West Windsor interests me (as I need to yell at all these kids to get off my lawn) but also because this could be the initial product of rising housing prices that were just taking off at the time of the census. Anecdotally I can count a dozen or so houses that have bought, gutted and now have families with children living in them. East Windsor remains fast growing for families sort of repeating the growth pattern of South Windsor in the 90s and early 2000s.
For the most part the new DA in Windsor did see significant numbers of new kids in 2021. Most of them would show up either as green or blue if mapped properly. The exception were those in Ward 9/South Windsor where their total children number was pretty flat as generational transition moves forward. In the County, suburban growth in Amherstburg is families while in Essex it is the more rural parts of the down that are seeing more kids. Leamington’s core bucked this trend with more of growth in children being in the established urban boundaries.
Young People (20-29 years)
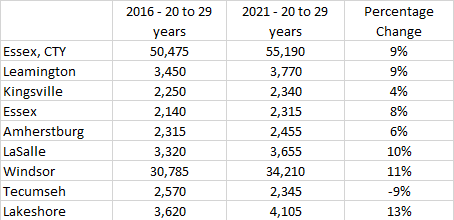
Another group that caught my eye were young people. For the last few censuses Windsor-Essex has seen a decline in young people from a total perspective. That seems to have stopped but the group does still seem to be shrinking as a portion of the overall population due to demographic trends (boomers hitting 65+).
We don’t know the full story around this data just yet as mobility and income data is to be released but there is a lot to be unpacked here. There has certainly be growth in this cohort across the region. At the time of the 2016 Census the Windsor CMA had the 4th highest rate of young people living at home with their parents in Canada. I would suspect that this trend is continuing in this data as local incomes haven’t kept pace with housing and rental prices. You have to remember that this was captured during COVID so even students at other universities who may have lived in another community may have moved home – “why pay rent for a virtual semester?”. Although the census does control for this, it certainly could have skewed responses as mom filling out the census for a household (with Timmy in the basement) is more likely to be completed than an enumerator trying to get a student house to complete one.
As mentioned in the section above a demographic transition is occurring in some communities that have seen younger cohorts aging into adult age groups. This really exemplified in Tecumseh’s data, which if you listened to my conversation Gary McNamara on Council Conversation, the town grew in the 90s and early 2000s, they are just about to start growing again. This has allowed demographic and market hopping – people going a few further KM down the road to Lakeshore. For Leamington and Kingsville, the growth and reliance on migrant worker to support the agri-sector, many of whom are in this age cohort, are captured by the Census. I can’t say exactly but Kingsville as an example grew in this age cohort at almost double the municipal rate, despite the 0-14 cohort shrinking meaning there are fewer young families. In Leamington, 2020 was marked by the need for Migrant Worker Housing.
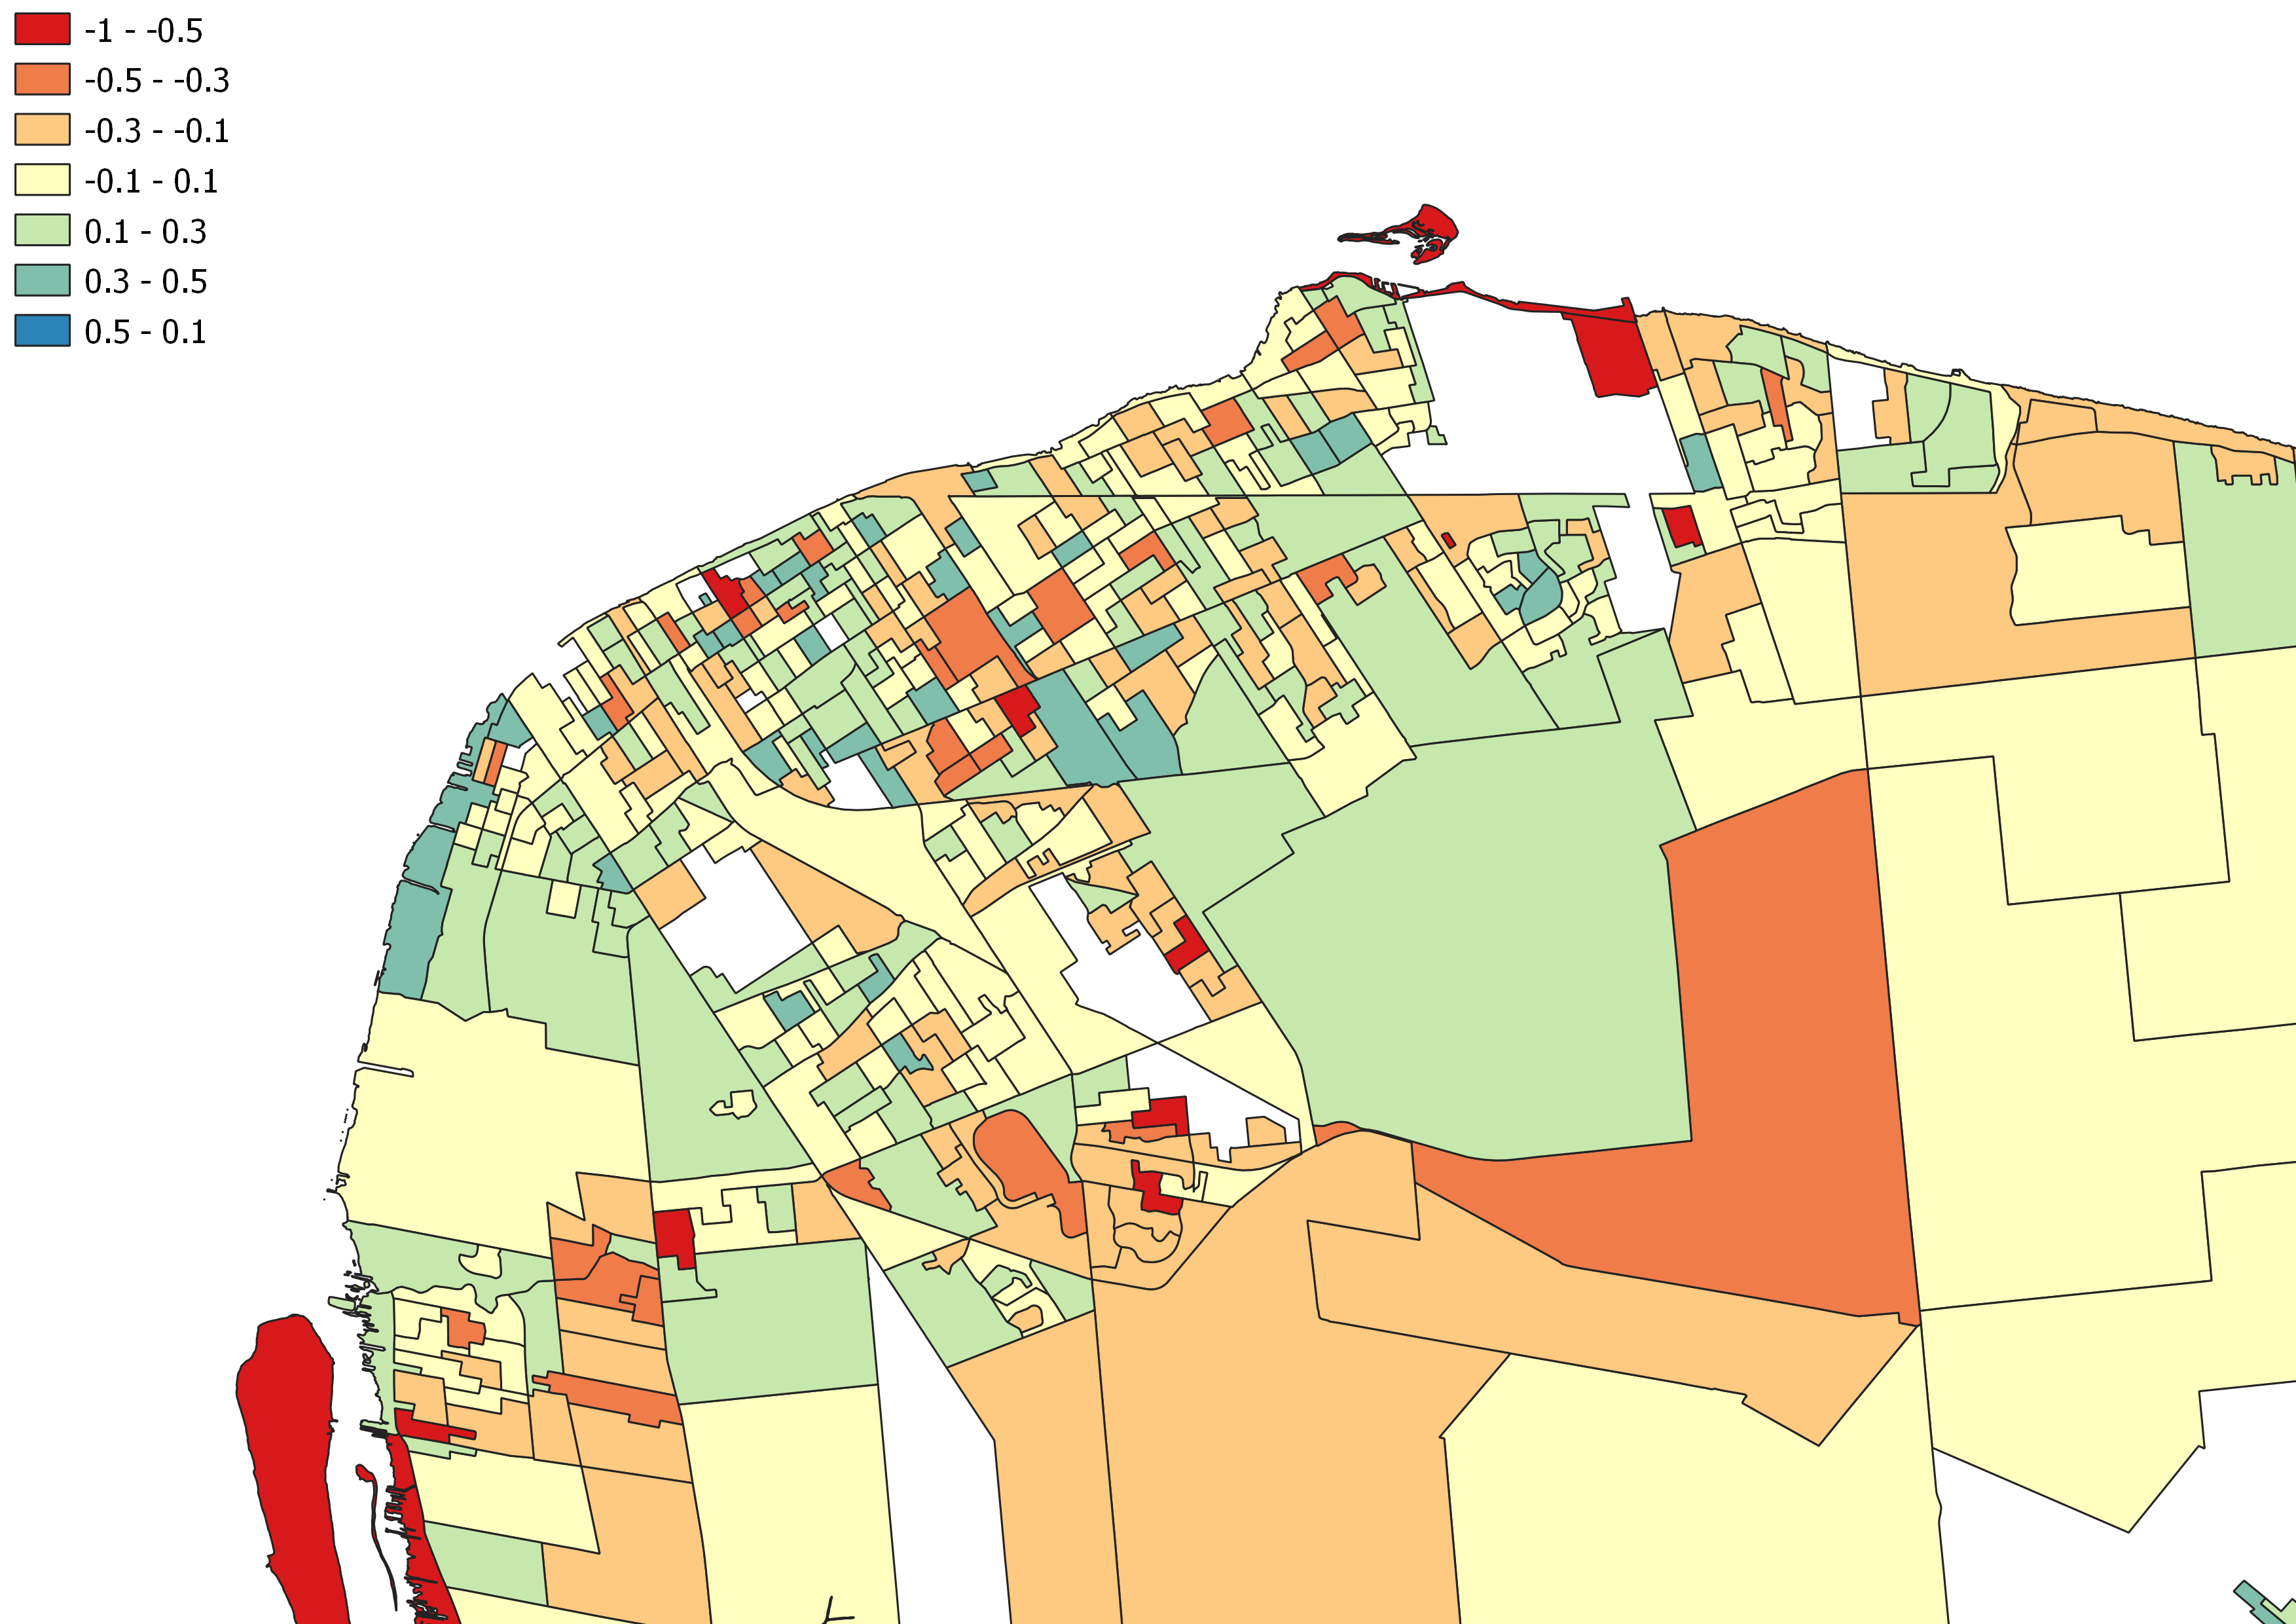
Zooming into Windsor, you would assume the University and College would be the home to all the university age population. Proportionally for the University that is true – but not every DA has equal populations.
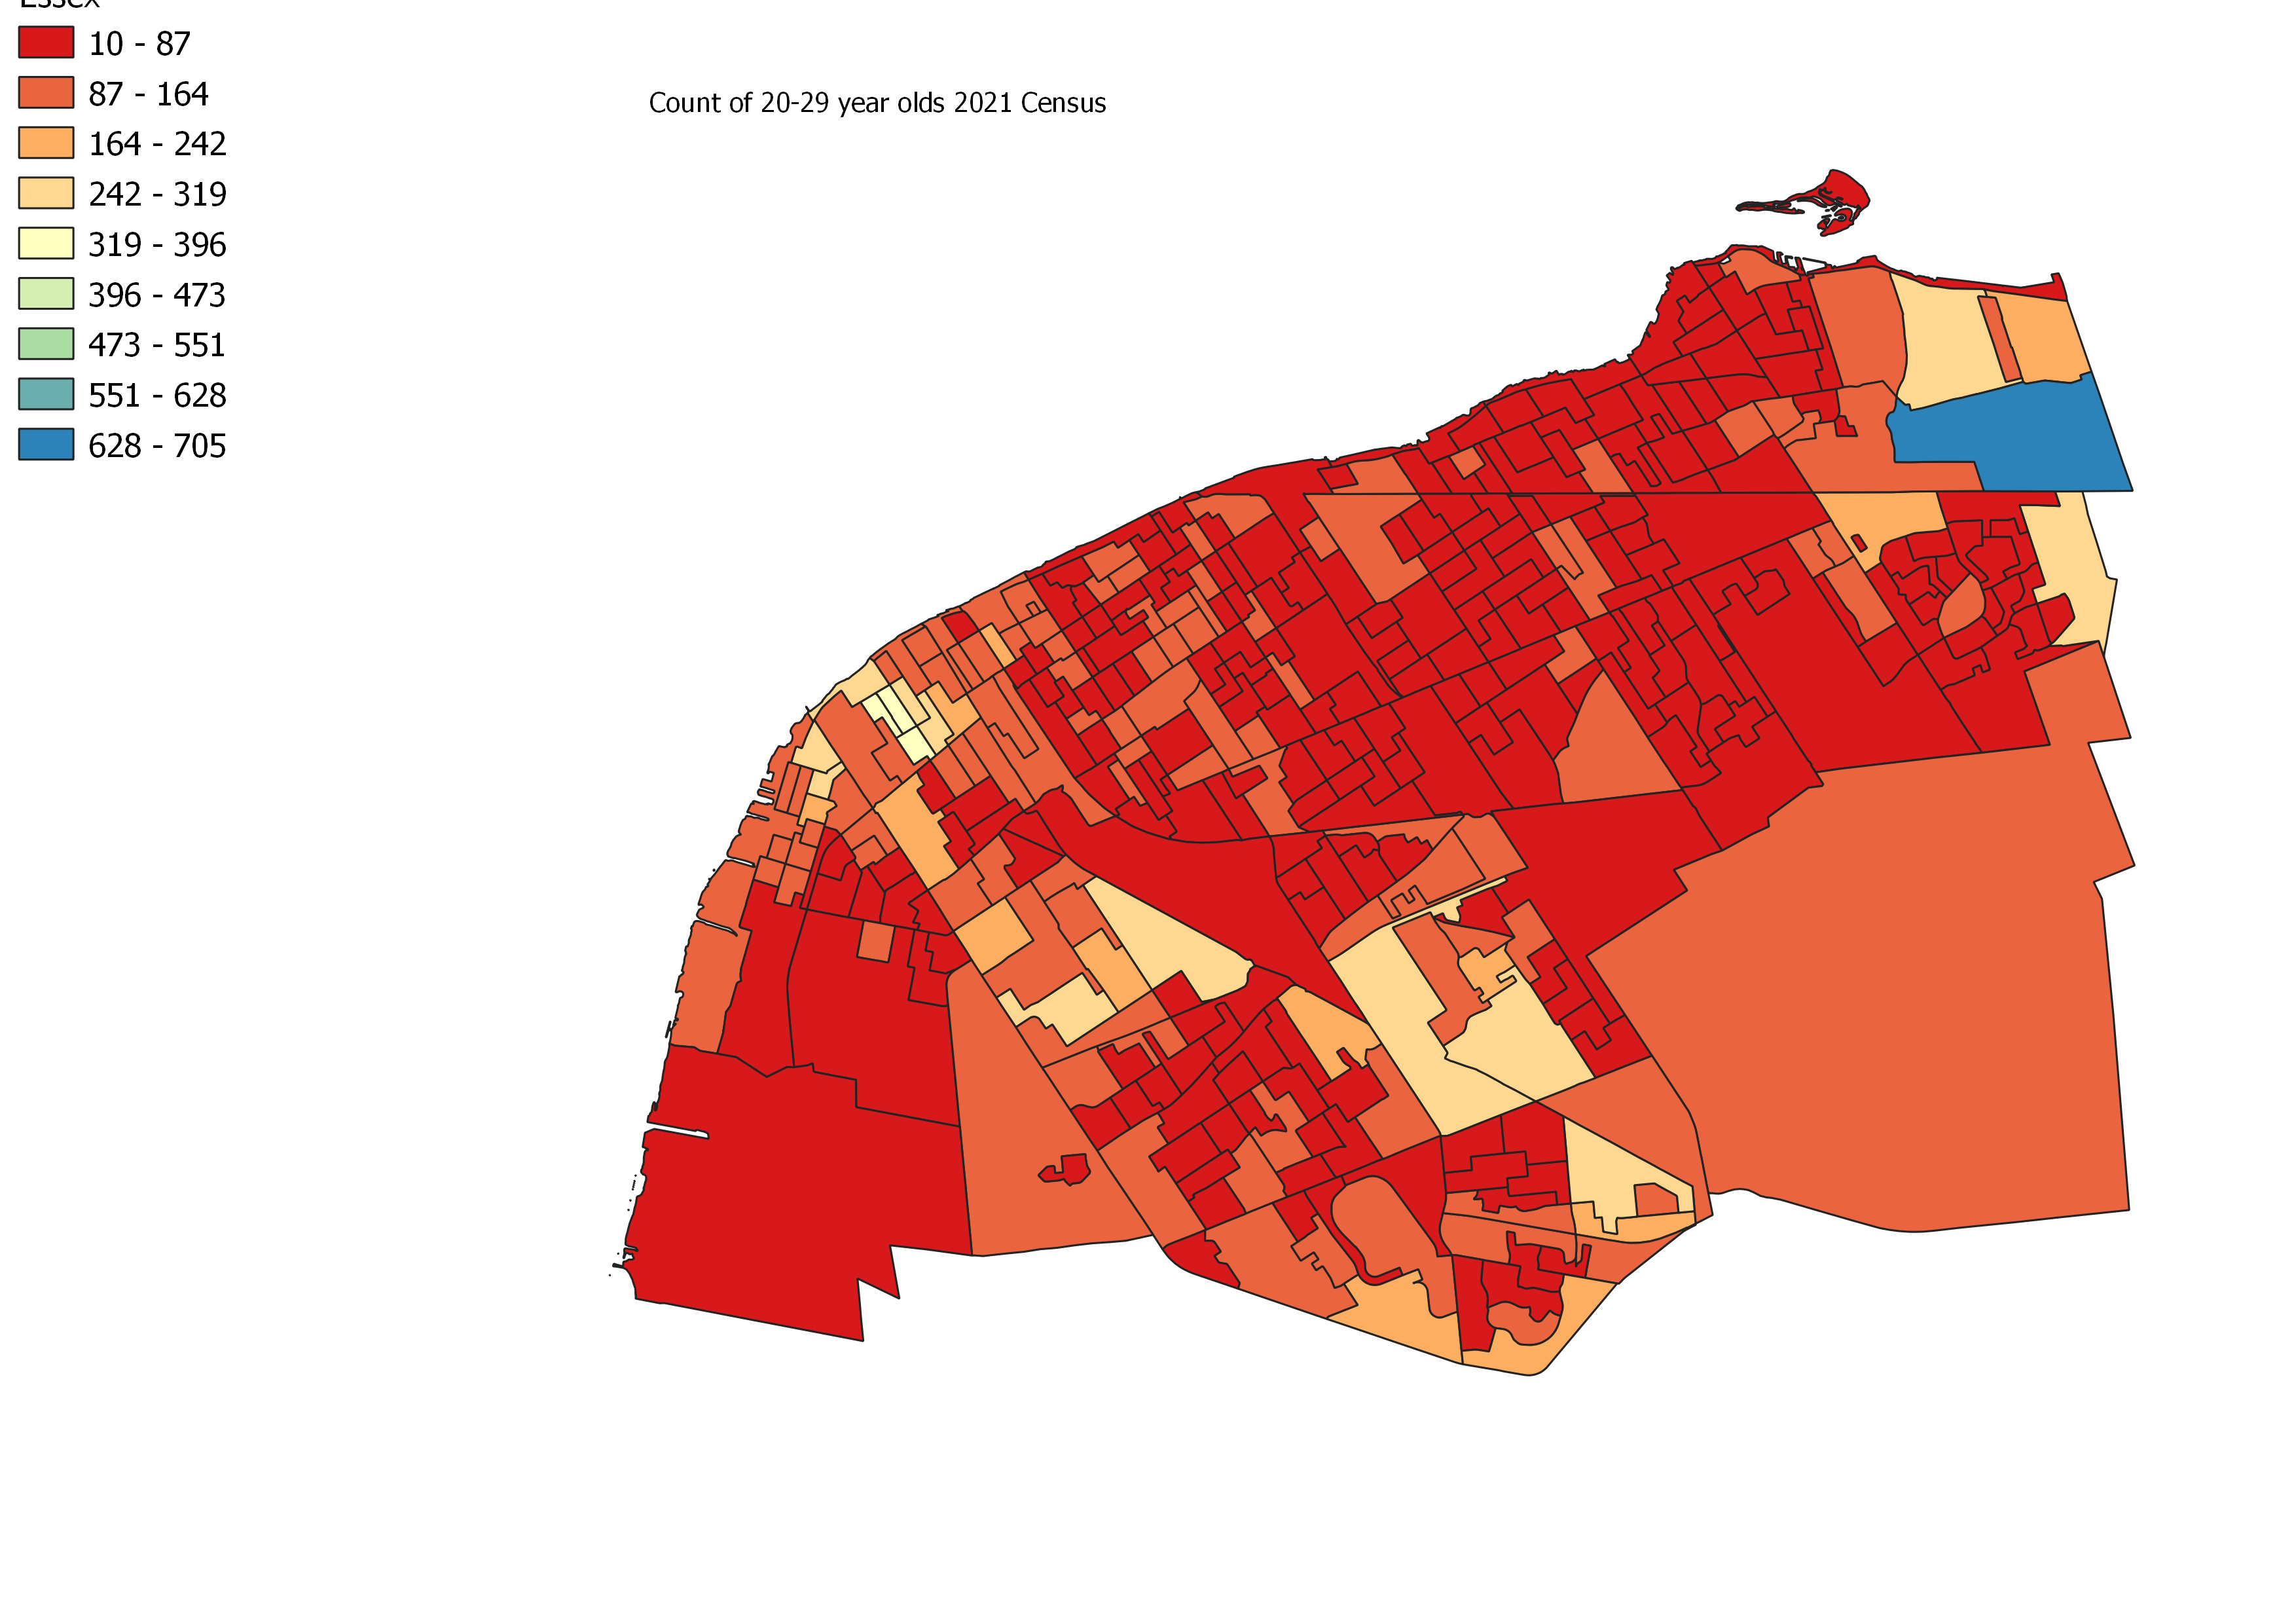
The concentration of young people in East Windsor, despite the proportionality of that area, is likely the reason that the 518X was created with something like 1,500 riders a week going to the Mall or St Clair College. The potential implications of this are interesting to consider.
Housing Type
The other block of data that arrived was on the type of dwellings that are in a community. A couple of things to keep in mind, these are dwellings that are inhabited not what is being built. What it does show is where do people actually inhabit at the time of the Census.
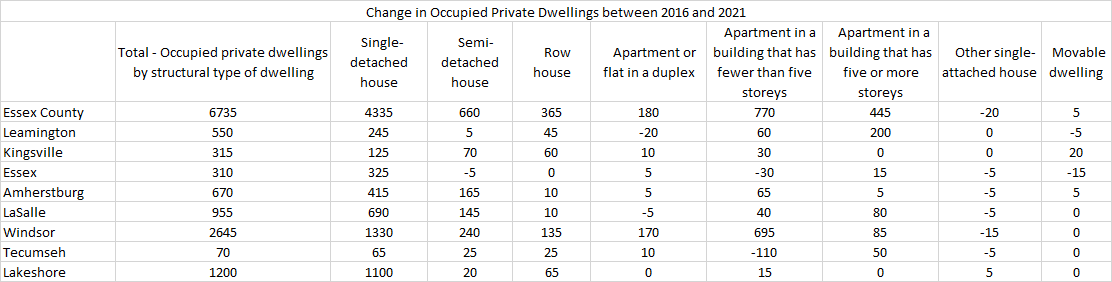
What jumps out at me is the growth in single detached homes in Windsor and Lakeshore accounting for over 50% of the regions change. Windsor obviously also account for the majority of larger apartment buildings (which includes condos). I am really not sure what is happening with the decline of small apartments in Tecumseh, I can’t think of a major building being torn down so it is likely small apartments or individuals units moving out of supply.
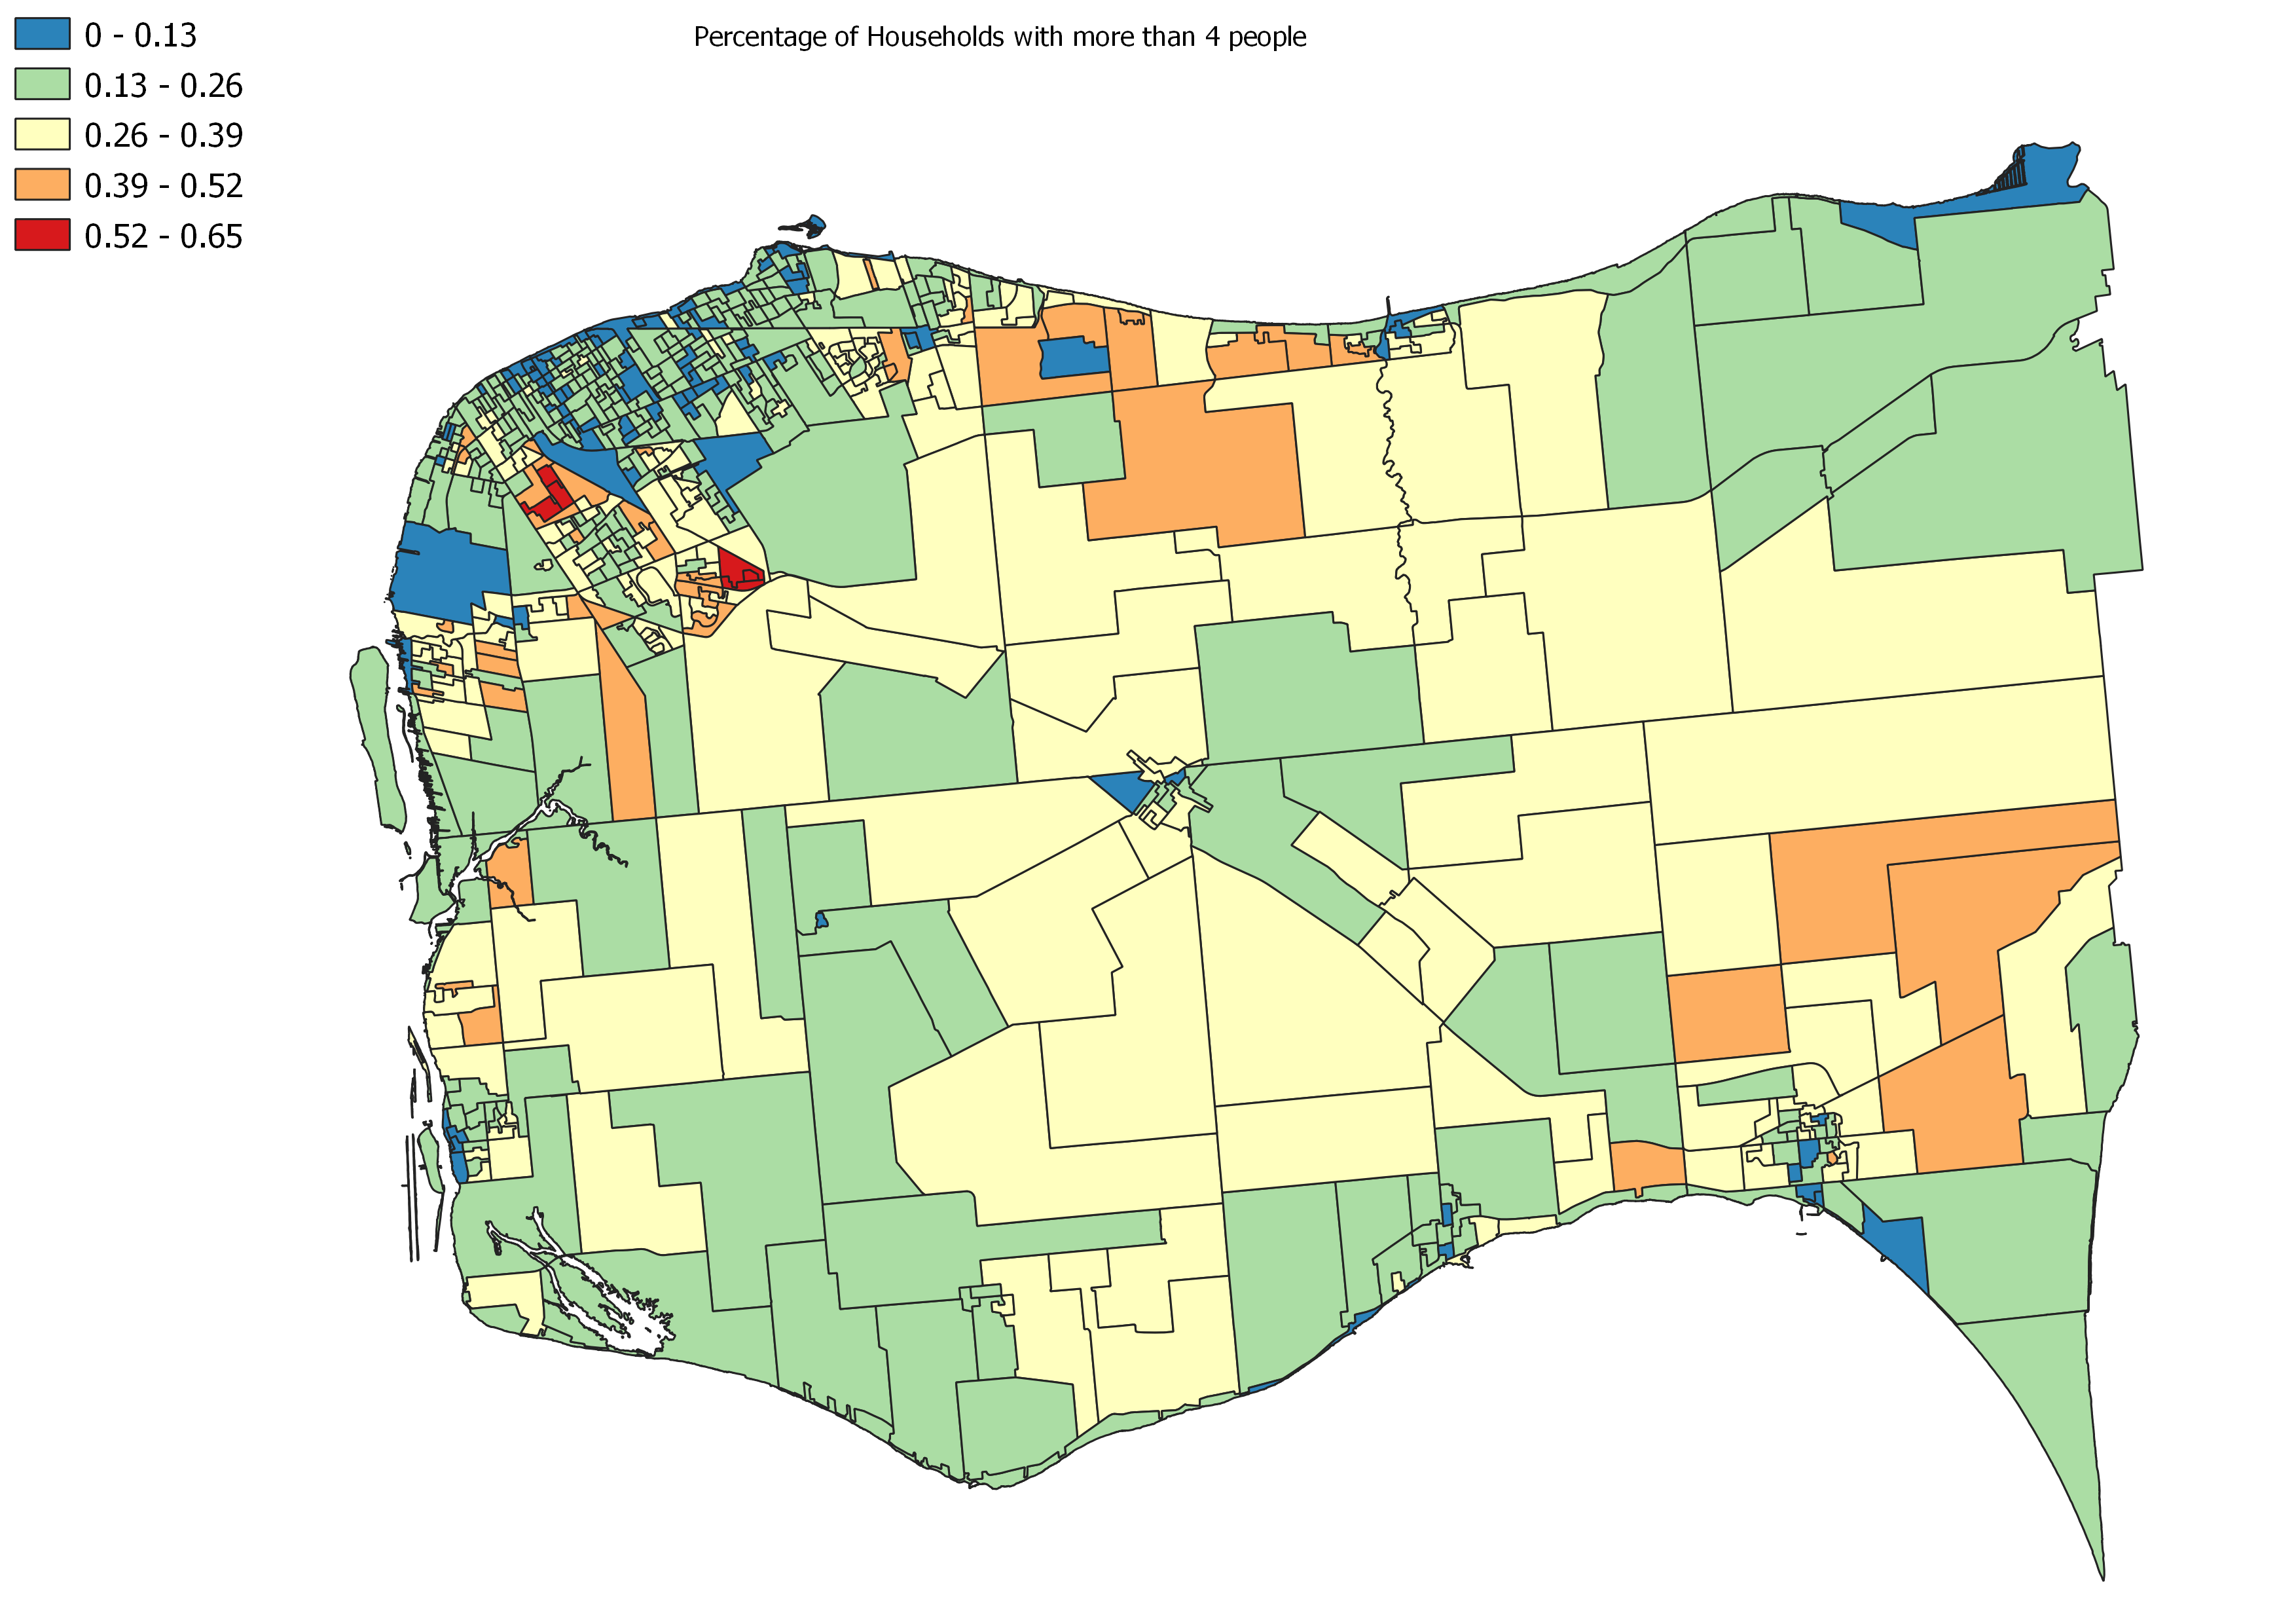
Beyond the type of housing, the number of people in households was also released. Region wide only about 23.8% of households have 4 or more people in them, and the average household size being 2.5 people in Essex County.
Agriculture
The census of agriculture is often the forgotten part of the census – the number of soybean farms in a region or province usually doesn’t grab headlines. The one item from this Census of Agriculture that did grab headlines was the story that Ontario is losing 319 acres of land per day to development. The first question we have to ask is what is happening here locally. Over the last 3 Census here is what the number of farms and acreages look like for Essex County.
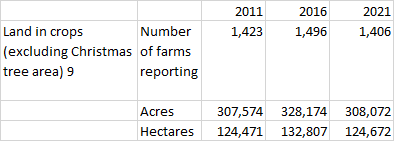
There are many takeaways from the longitudinal table above is how each type of farm and their numbers in our region impact it. One of the reasons for the variation is the response rate to the Census of Agriculture that sees a number farm types suppressed in the data a Census Division (county) level.
The actual number of farms is 1,594 in Essex County but not all of these farms have land in production for crops/live stock etc. So when you see variation in farms and acreage it isn’t solely because it is being paved over, but it is land and farms, entering and exiting active production. As an example there over 8,400 acres of woodland and wetlands on agricultural land in Essex County. Odds are that land will never be productive but it is captured in this data.
Concluding thoughts?
The next Census release is out July 13th and featured a new method to measure poverty in Canada. Lucky for you, I will be talking about this on the next Mean, Median and Moose where I will talking about how we calculate poverty in Canada which should be out before than!
This will be a seminal conversations in our community. We were the highest child poverty City in Canada after the last Census. If by changing how we measure “who is poor” there are suddenly fewer poor people we have to think about those who are living, a few dollars or more above that arbitrary threshold, they are not measurably better off. I hope to have a quick turn around on this data, but my busy “lifestyle” may get in the way.
