Today, xmas comes early for nerds like me as Statistic Canada released the geography files and definitions for the 2021 Census. Although data won’t be released until starting in February (schedule below) you can glean certain things from the changes in the mapping files particularly at lower geographic levels.
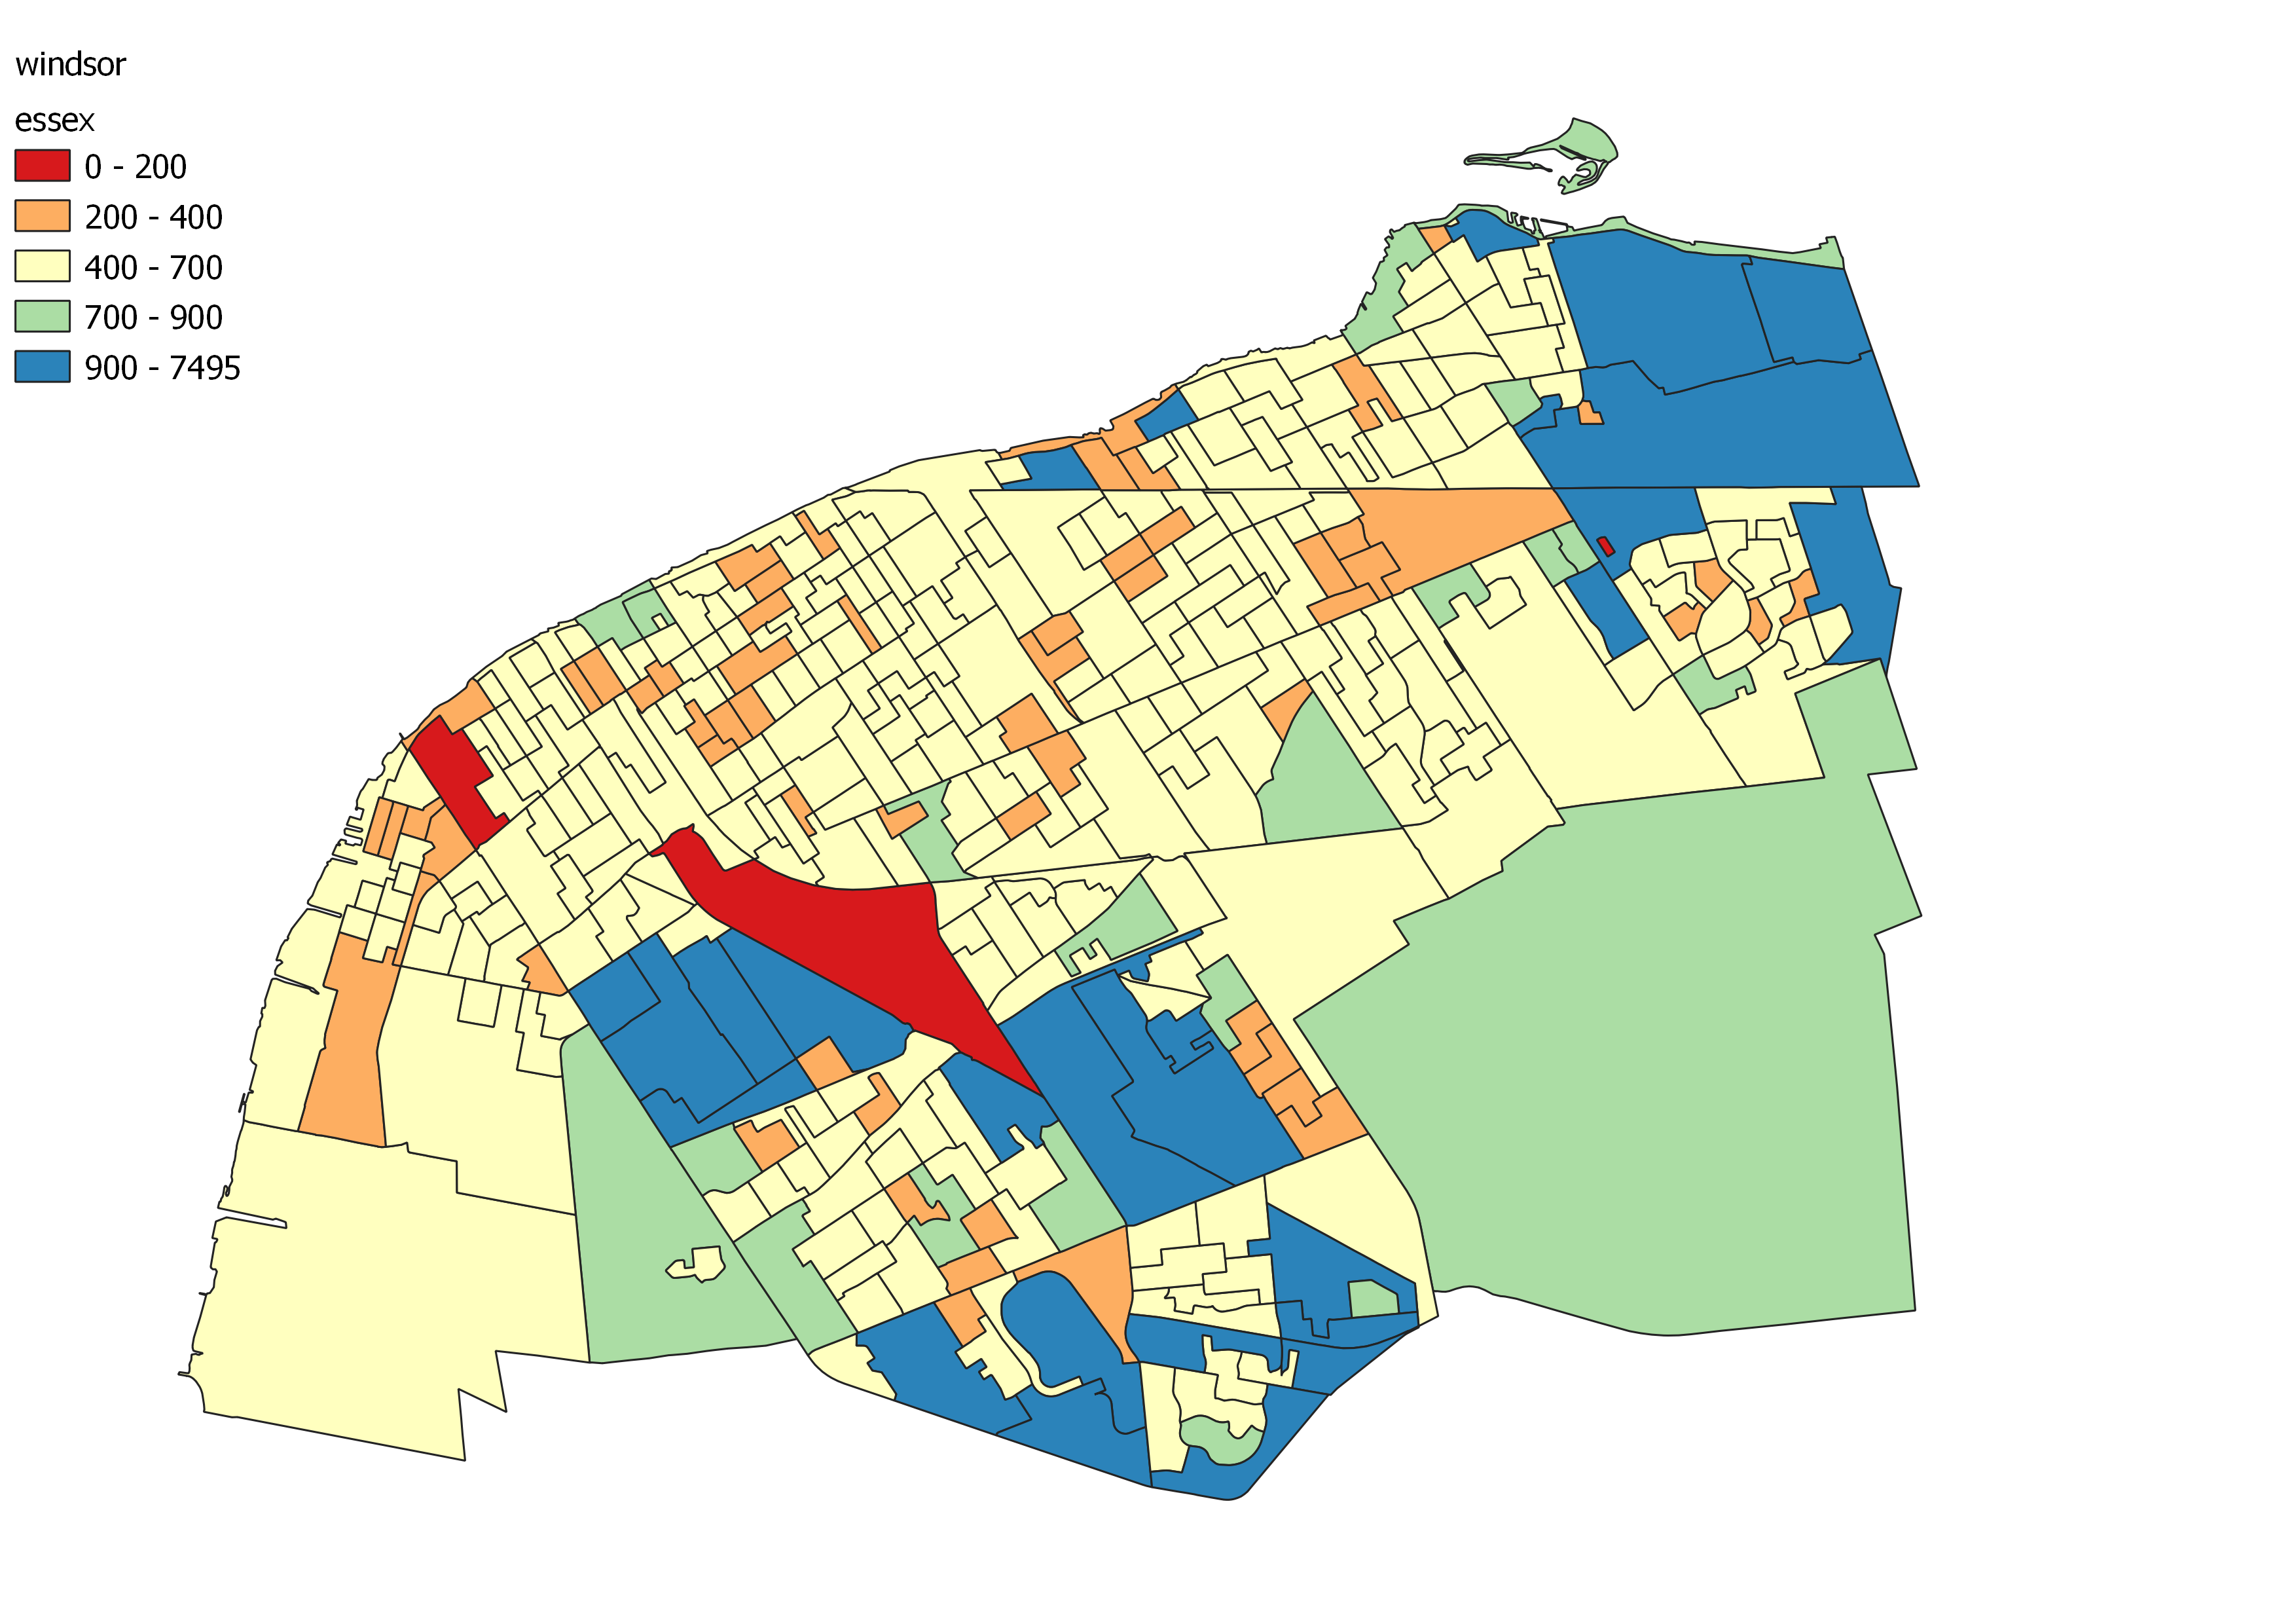
A Census Dissemination Area (DAs) is the smallest geography that Statistics Canada widely and publicly releases (there are more refined data but you need to access at an academic data centre or pay for it). The key thing to remember is that Statistics Canada defines DA as geographies with between 400 and 700 permanent inhabitants. We can therefore look at the 2016 Census map and estimate where new DA will be created based on old population data.
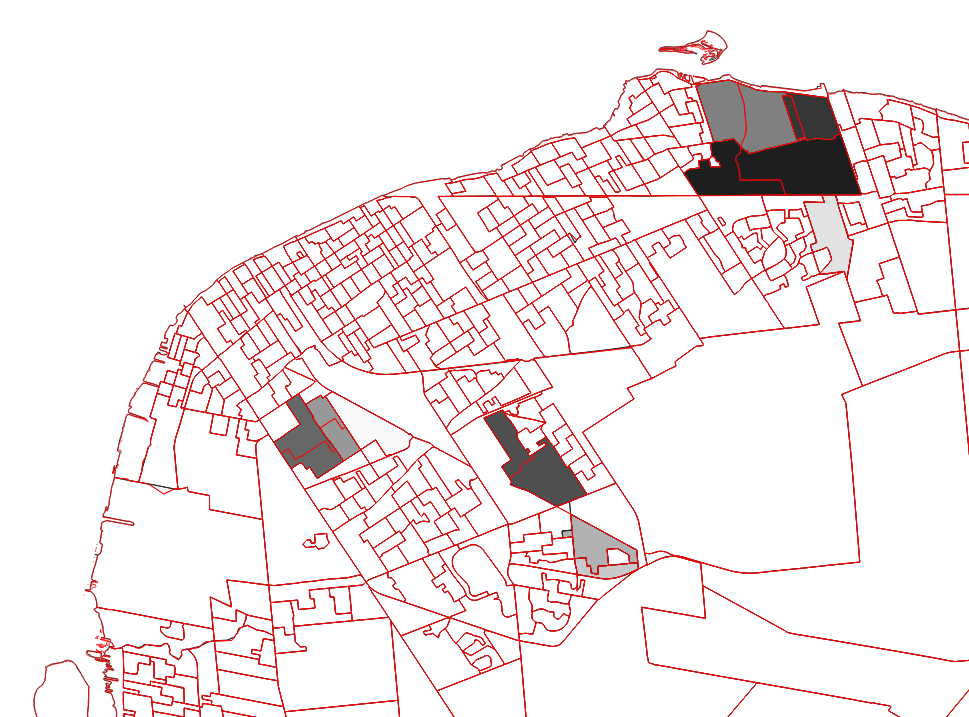
2016 Census Windsor Dissemination Areas
Currently there 376 DAs in Windsor and 284 in the rest of the Essex County.
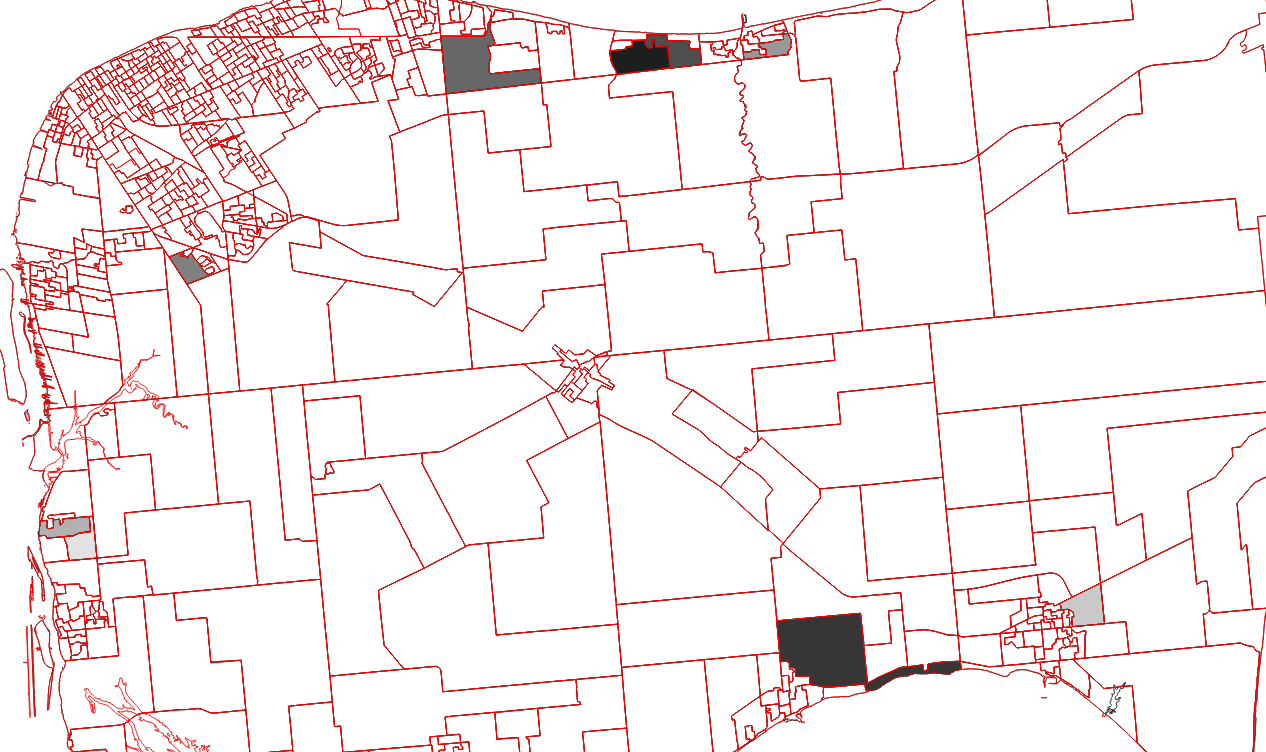
2016 Essex County Dissemination Areas
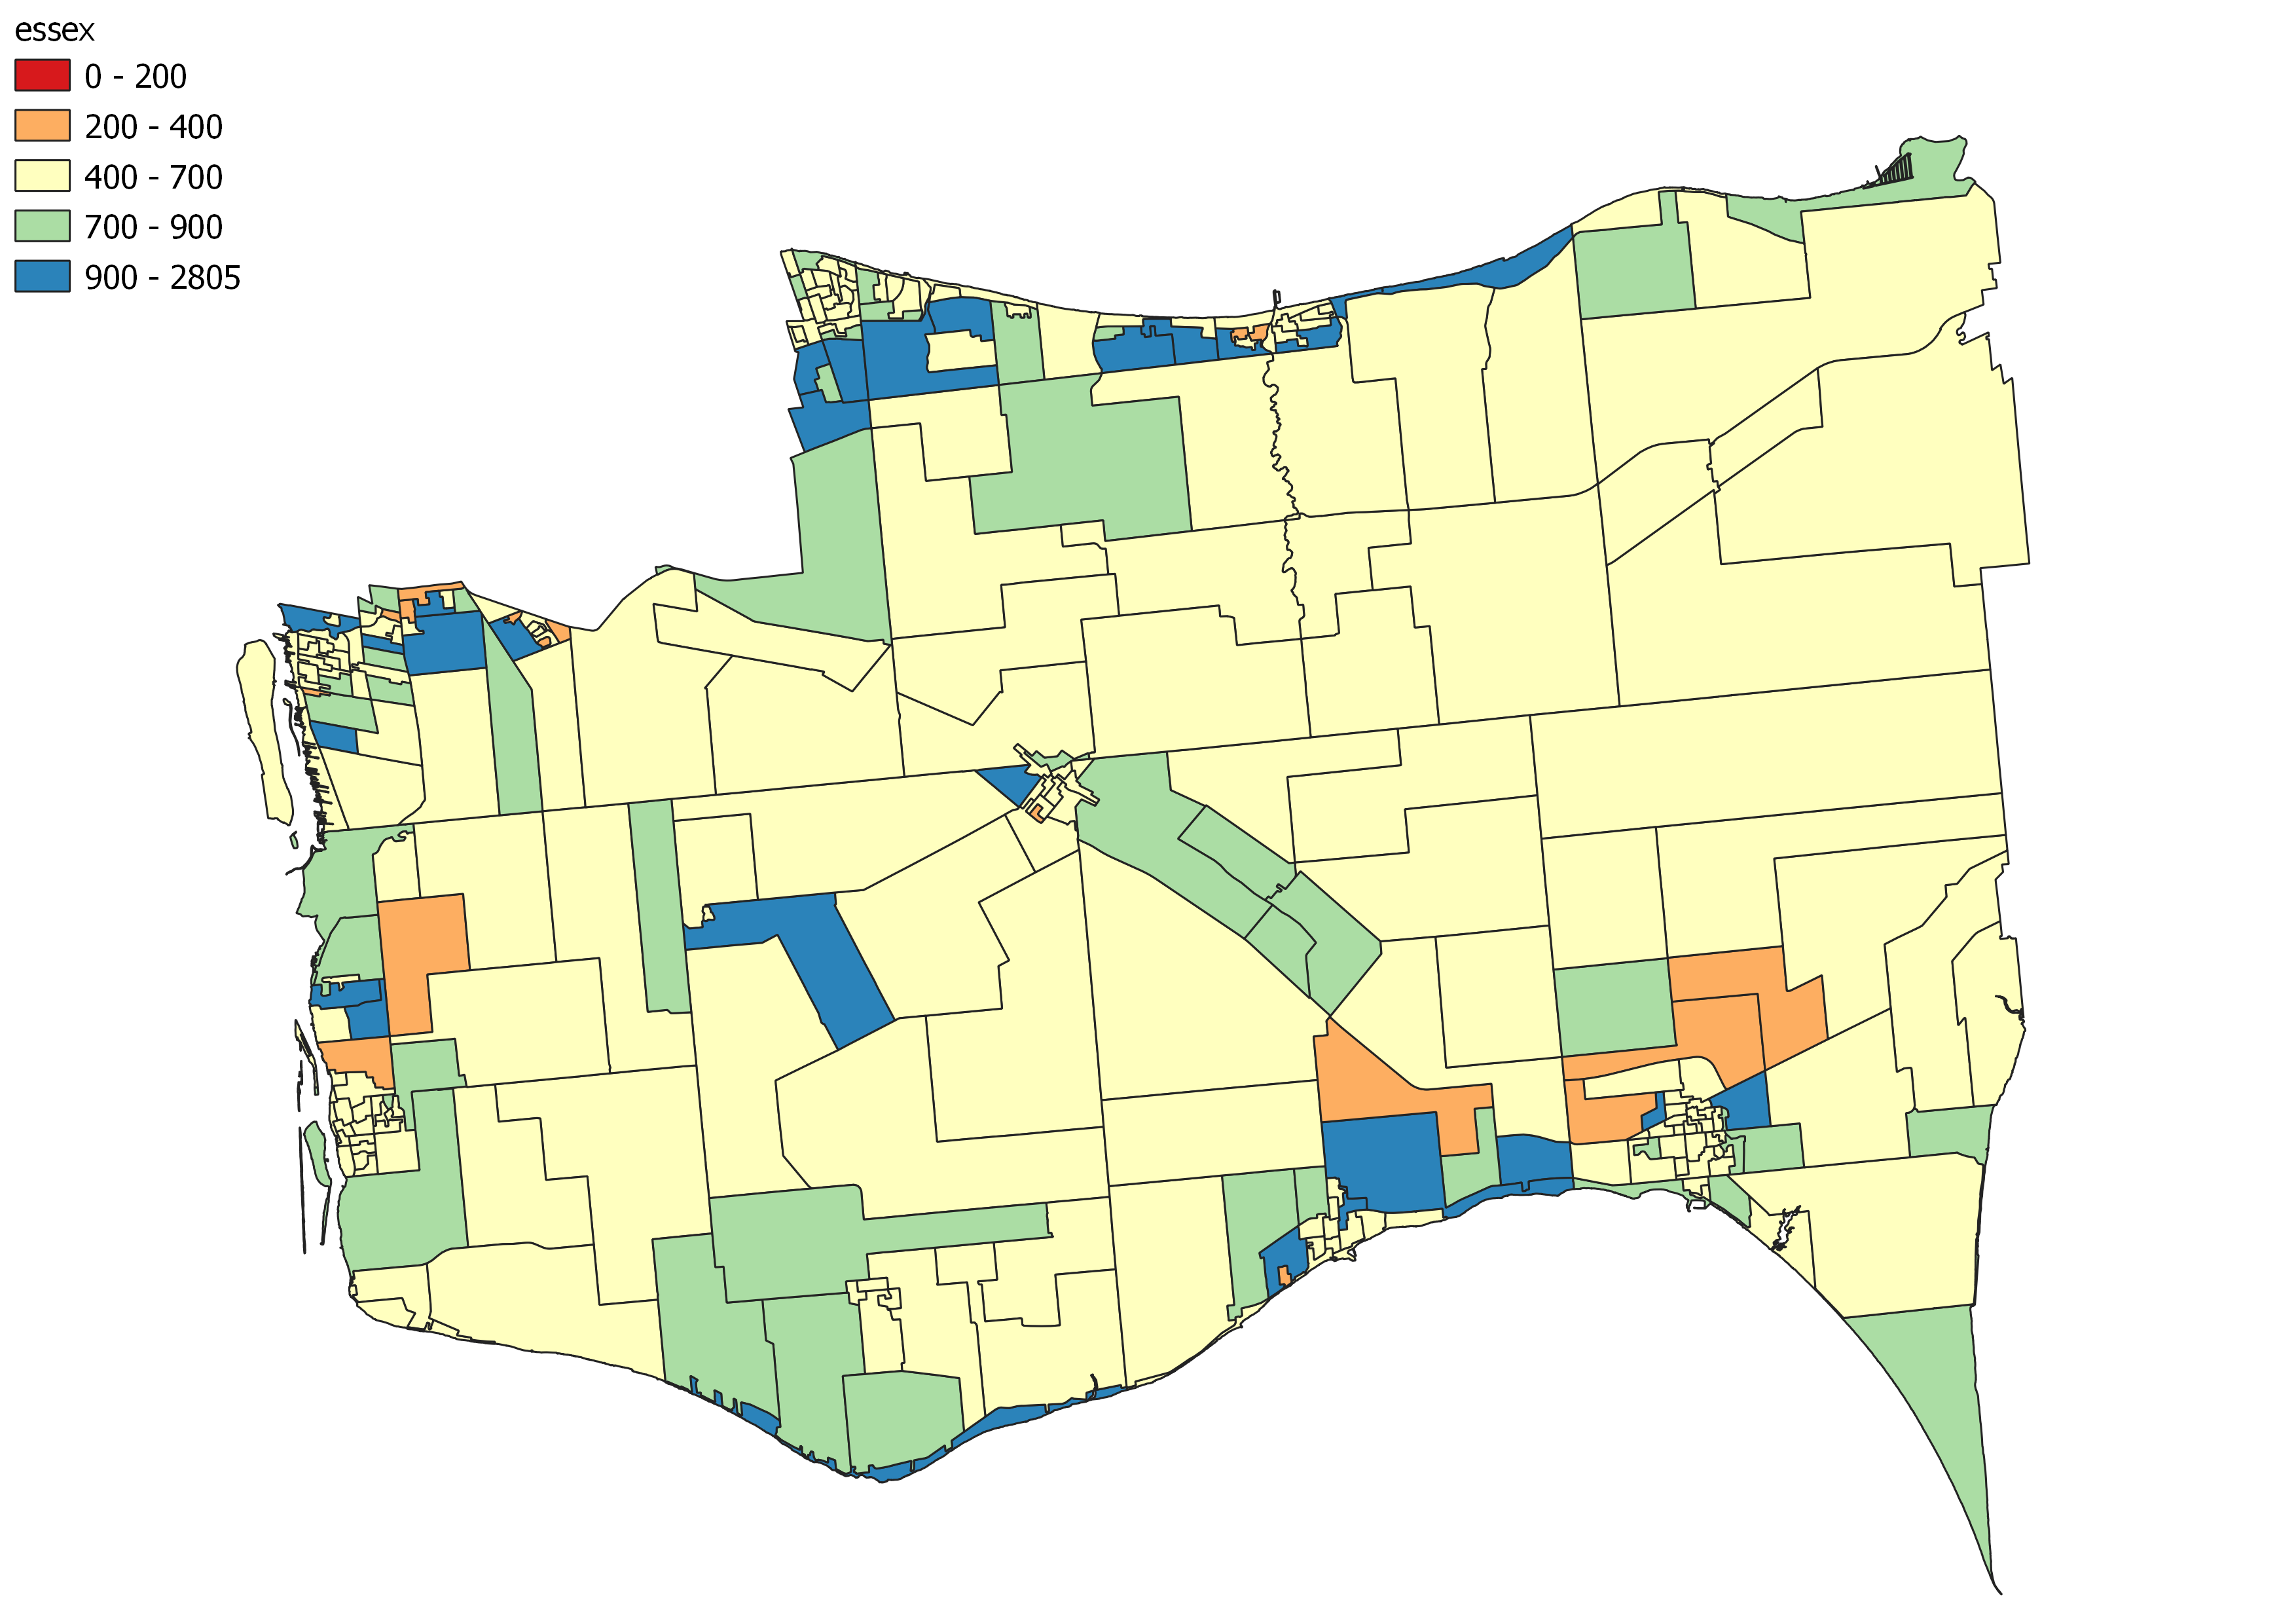
The above maps show the populations of DA at the time of the 2016 Census. How you should view these maps is as follows:
- Yellow is unlike to change unless the population really grew or spillover effect from other DA being merged.
- Green and Blue are over populated by large margins and could be where a DA may get chopped in half or a small cluster of 3 or 4 DAs get split into 5 or 6. Blue are areas of most likely to be broken up.
- Orange DA are unique. Some of them are DA that have shrunk to their current size. Statistics Canada doesn’t like to delete DAs so it is unlikely they will be merged or removed unless the population decline is precipitous.
- Finally the there are 3 red areas on the map, 2 are unlikely to go away – University of Windsor and the area that is largely covered by the CN railyard off of Dominion Road. The third is a single block of housing in East Windsor that is just there for some reason. It is just off Teedie Cres. and Carissa Ave. This one confuses me and I am not sure why it exists.
This does not mean they will create new DA’s in any or all of these areas. There are a number of reasons why they may not want create a bunch of additional dissemination areas but the blue areas on the map are most likely to see new dissemination areas.
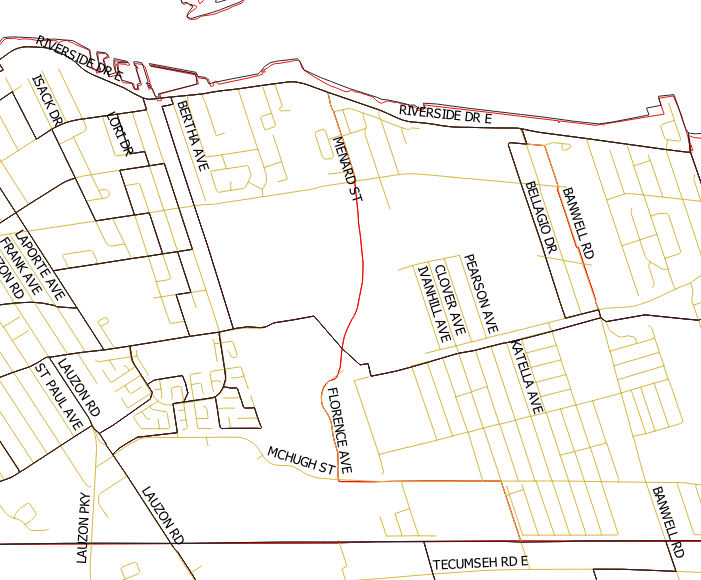
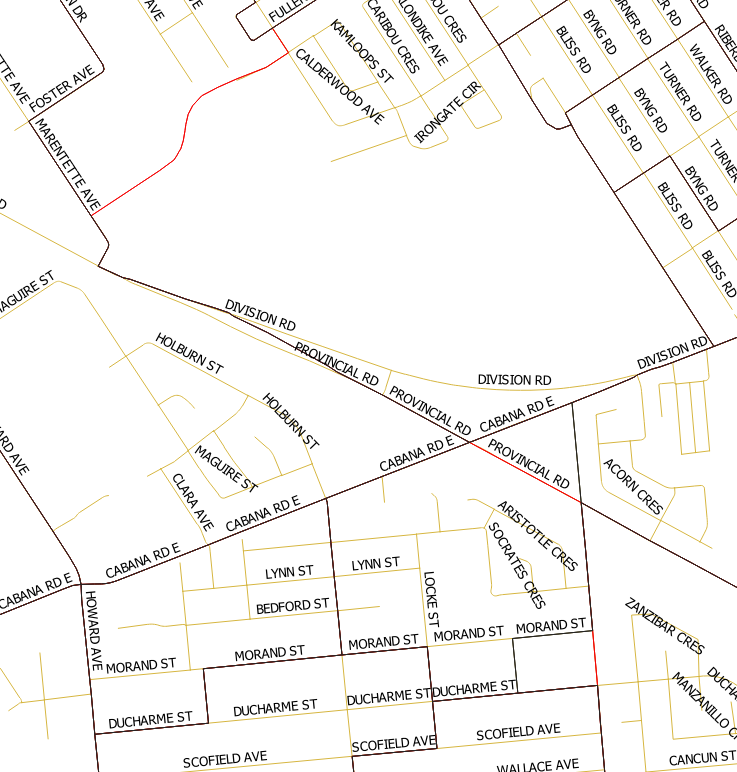
2021 Census Map
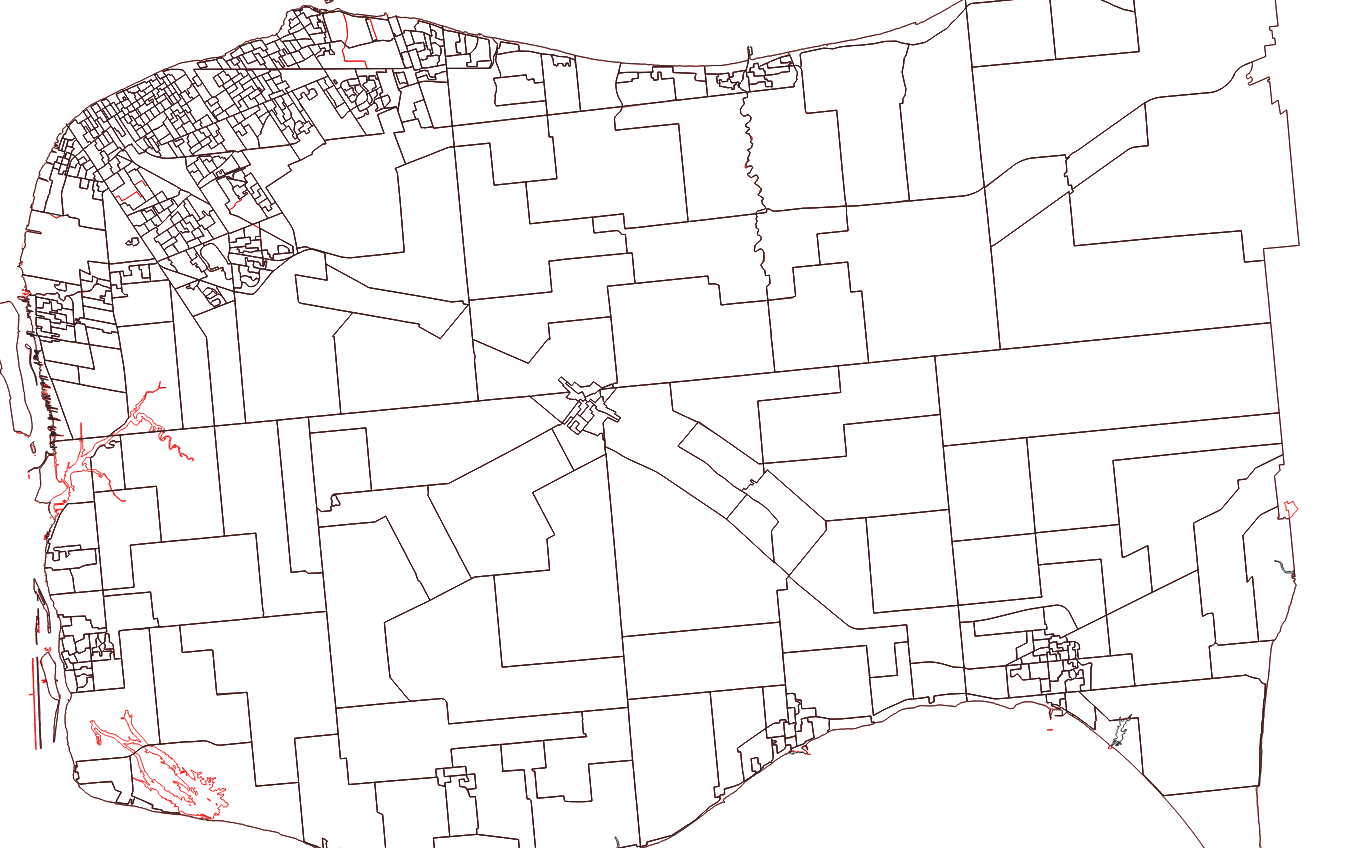
By my count Windsor added 8 new DAs while the County added 0. The map also added some geographic features that layered on top of the map list River Canard. In 2016, rivers and waterways were a separate shapefile so it seems like some of those details are now in the core file. In the following maps the red lines represent new 2021 Census boundaries. Black boundaries are 2016 Census boundaries, in most cases they cover the 2021 boundaries. I have overlaid the City’s road network map to give context of where we talking about in the City.
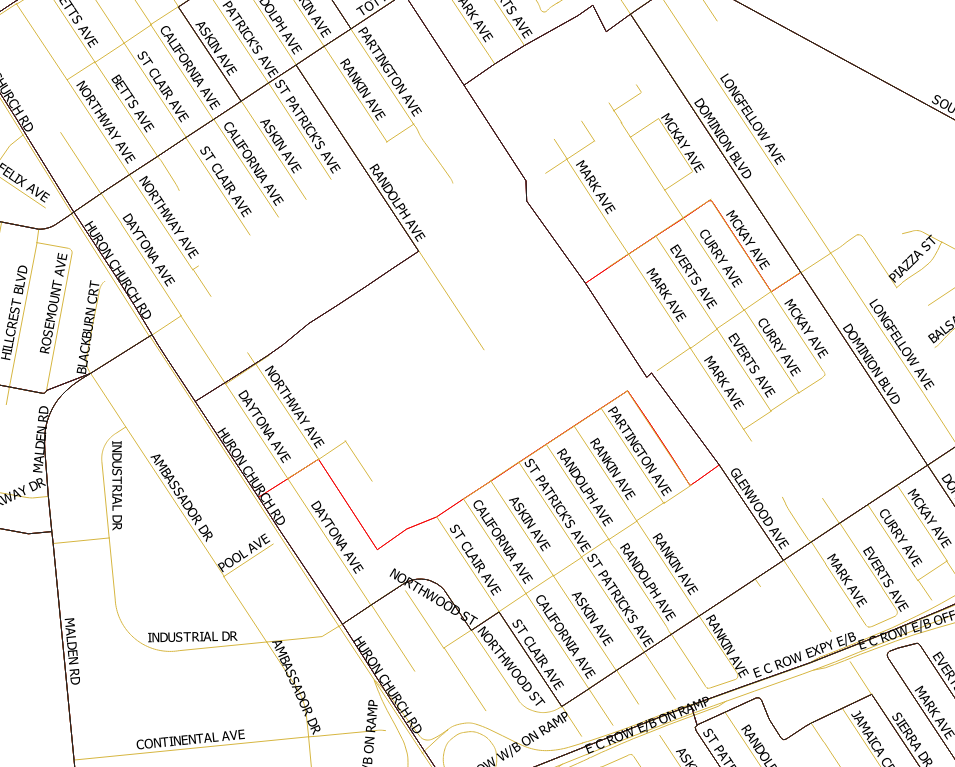
Why There?
First where DA were created, were in the areas of highest need. Sorting through the Census DAs from 2016 Population counts we find this
So 9 of the 10 largest DA in Windsor were broken up or impacted in some manner by the new Census Map. In the County it looks like this.
These 10 DA represent fast growing suburban neighbourhoods and developments within the County. The hardest hit is likely Lakeshore where places like Puce and Belle River are likely owed and extra DA or two which would certainly support a better understanding of a rapidly growing part of the region. The Kingsville area is a weirdly shaped DA that is begging to be chopped in two but it is likely that the growth in the North end of the community hasn’t yet reached a threshold where they could confidently remove the lakefront sections leaving two viable DAs. What is weird is that both the Lakeshore and Kingsville DAs are about as populace the Ward 10 DAs that were broken up in Windsor.
What to Think
Statistics Canada tries as best they can to not to create new geographic areas. They do this for a few reasons but the largest being that they want to maintain geographic consistency overtime. This allows for research comparison without having to try and transfer data across geographies between Censuses. It also takes a lot of time and effort to manage and curate the datasets not just in the census of other collections that leverage census geographies.
The other item to takeaway is that this may provide a hint or two where population growth is occurring in our region. Odds are that many of these DAs are still over populated but not as extreme as they where. If we have seen large scale population it is quite possible that a future Census could see a larger scale realignment of local geographies which could actually more disruptive to geographic consistency. The implication of this is that the granularity of our local data is going to degrade a little bit. In 2016 you had 660 DAs for 398,000 people, just over 600 people per DA. They added by my count 8 additional DAs through splits which lowers a 398,000 person population down an average of 595 people per DA. The Windsor CMA has been growing, if we are averaging 3.5% population growth between census (a robust amount) it would put Essex County population around 412,000 which raises the DA average to 616 people. This doesn’t sound like a big deal and it is hovering near the top have of the DA population range, but what happens is you end up with more noise in the data and in your population samples. A fast growing DA can drown out percentages and averages within the data. This can lead to a poorer understanding of what is happening in part of our community and region.
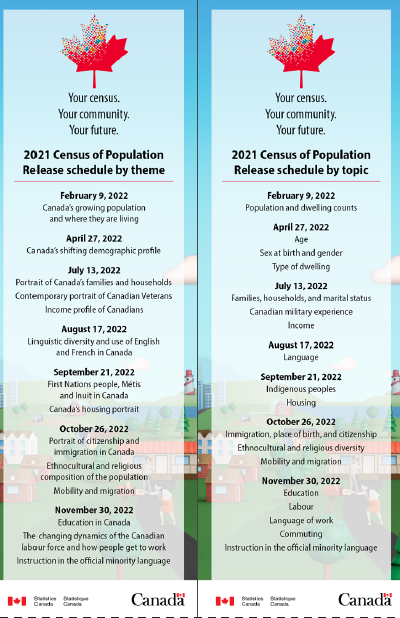
We are 87 days until these questions get answered. Below you can find the full release schedule of the 2021 Census based on topics and theme analysis that Statistics Canada will be releasing.

Pingback: A Few Things to Watch in 2022 | gingerpolitics
Pingback: 2021 Census of Population | gingerpolitics