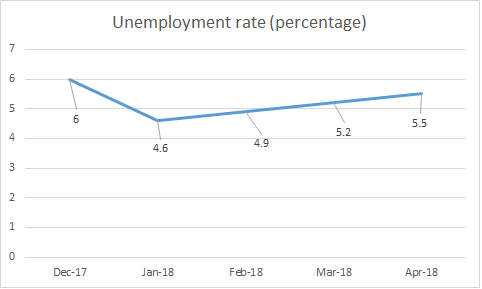
Back in Feb. I was interviewed by Dave Battegello of the Windsor Star on the City’s unemployment rate. At the time our City’s unemployment had fallen from 6% in December to 4.6% in January.
In the interview although I agreed that the drop in unemployment was good news, I cast some healthy skepticism on the data:
Frazier Fathers, manager of community impact for the local United Way, said the last month’s jobless number for Windsor may be good news, but whether it’s really reflective of the employment sector locally remains to be seen.
“Statistics Canada’s survey is a relatively small sample,” he said. “Sometimes month to month it may be higher or lower. What you really want to look at is the trend. If the number remains the same next month and the month after, that would be really good sign.”
Poverty does remain high in Windsor and the job participation rate — those in the community actively working or seeking a job — is about five per cent lower in Windsor than the provincial average, Fathers said.
“You have fewer in our economy who are working. We have lost a lot of good-paying jobs and some jobs have been replaced with lower paying jobs,” Fathers said. “Seeing the low unemployment number is good news, but whether the number is real remains to be seen.”
This opinion wasn’t that popular in some circles.
For those that don’t know, the unemployment rate is calculated through a monthly survey across the country, the Labour Force Survey (full guide and details of the survey can be found here). In summary, Statistics Canada surveys a rolling sample of people in our region (and in regions across the country) on a monthly basis with approximately 1/6 of the sample turning over each month, with people dropping off and being added in. A selected person would cycle through the labour force survey in 6 months. It is from that sample that the local employment, unemployment, participation, and other rates are calculated.
So give the design of the survey a month to month decline of a significant nature is a rare event. The rate drop from December to January was triggered by 3,700 people in the Windsor CMA finding work that month, a significant change given the lack (from my recollection) of significant hiring announcements. Given this along with the fact that this change represented only the 3rd time in a 15 months the participation rate rose above 61% it told me that this number was soft. By soft I mean that it was more of a statistical vagabond rather than a true indicator of the local economy.
Now, 3 months later I am ready to say I was right, that number was Soft! Although I would agree that January was a good month for the Windsor CMA from an employment standpoint, despite the fanfare awarded to the sudden drop in unemployment those gains have slowly been given back. Although total employment is actually up since January that is only true if the CMAs population grew by 1,600 people as the participation rate has dropped back to 60.5% (it has averaged 60.3% since Dec 2016). The actual labour force size has only changed by 100 people between December and April’s employment numbers with the exact same employment rate (57.1%).
The fact that the unemployment number has subsequently inched back up by equal intervals (0.3%) hints at a over representative sample being added in January. As the chart below illustrates there is a steady uptick month after month in the data.
Beyond this slow but steady up tick in the intervening months the other factor that I want to touch on is the margin of error for our local labour force data. Each month there is 0.8% standard error on the reported value. Almost a full percent in variation! The graph below shows the same rates with their confidence range:

Given that we are adding almost a full percentage (or subtracting) the question is why are celebrating this number every month? This is why economists call the Labour Force Survey as a “random number generator” and actually have turned the data release into a bit of a guessing game each month on twitter #LFSGuesses
