On Wednesday, the next batch of Census data is released and it is the only standalone data set of the year: Income Data…
In 2011, the Census tracked the status of Windsor in 2010 during the teeth of the recession. The question at hand is how far has Windsor and Essex County come from the from that low point. In 2011, Windsor was home to the highest rates of low income people living in low income neighbourhoods in Canada; 1 in 4 children were growing up in Poverty; 44% of single mothers lived in poverty are just some of the top line items.
When mapped it looked like this: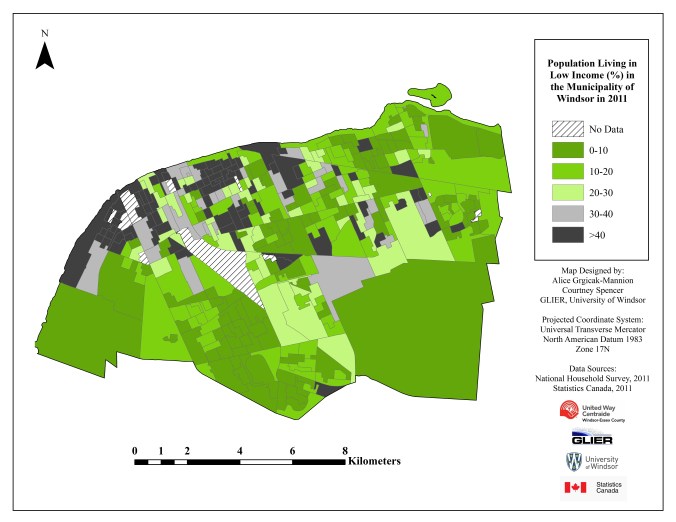
One of the more interesting maps actually comes from the Median Income levels of each of these neighbourhoods.

Obviously median income shows what the middle income of the population of income earners is within a particular space. The scaling I used on this data is a broader than has been previously mapped in our community.
What to Watch For Tomorrow:
- How big of a swing in low income % occurs
- There are going to be major gains in poverty reduction in our community, largely because of the improvement in the overall economy. What is happening at a neighbourhood level? Some neighbourhoods had poverty rates in 2011 in excess of 75%, even if significant gains are made what are the poverty levels in these areas? Are we willing to celebrate 1 in 4 in poverty in some areas
- What about specific demographic groups in our single parents, seniors and children fair?
- How does median income change in our region? Based on the mapping above basically 1/3 of the neighbourhoods in Windsor had a median income less than the poverty line. How has that improved.
- Also looking at the urban/suburban spread. With the exception of Walkerville (5 top richest neighbourhoods in all of Essex County in 2011) how does the core do in comparison to the suburban fringe and the neighbouring suburban municipalities?
- Gender split in median income isn’t something that I have looked to closely at but it would be interesting to see how that has changed over time.
- How do these numbers compare to 2006 and 2001 prior to the great recession?
Once this data is available a big thing to consider is how we build resiliency in our community. If the swings that we see are largely just driven by economic cycles the question becomes how do we invest now to ensure that during the next downturn things don’t get as bad as they did in 2011.
