So we are in a housing crisis…. I don’t think anyone is surprised about that. I talked a bit about affordability with CTV a couple of weeks back. Fundamentally the trickle down of the housing market is spilling over to other aspects of people’s lives driving other affordability challenges resulting in rising use of Food Banks and other social supports.
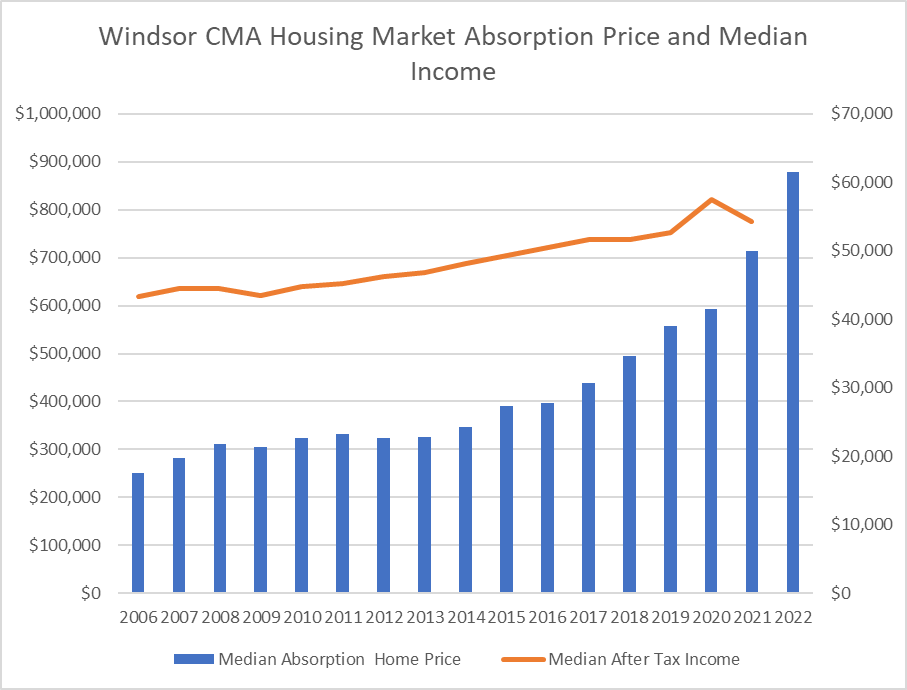
The chart above brings together two data points for the Windsor CMA (old definition Windsor, Lasalle, Lakeshore, Tecumseh and Amherstburg). The first is the median after tax income – which uses the right axis. It shows how the median after tax income has climbed from ~$43,000 to ~$54,000 in 2021. This growth is approximate ~25% change over the 15 years or about 1.66% annually.
The blue bars represent the median absorption price of housing. The absorption price is the price of a newly constructed unit that sells in the market, this value combined single, semi, and row housing types. You can see the rise between 2006 and 2022 – 249%. For context the annualized inflation over that same period was 38.98%. So not only did purchasing power decline during this period but housing prices exploded.
The rise in new build cost, carries over into the core housing marketing as people who are priced out, then purchase existing homes at higher prices which in turn raises home prices overall. For the median homeowners, all homes are now unaffordable. If you place that median income into a big bank mortgage calculator and assume average expenses they can be pre-approved for only ~$180,000. In other words for more than half of the households in the Windsor CMA – the dream of owning a home is largely dead.
Building
The only way out of this struggle is to build homes at unprecedented rates. We are talking all home -rentals, condos, row houses, single detached, tiny homes etc. etc. The law of supply and demand dictates that is mass construction has to happen pretty much everywhere in Canada as if we are successful, but London isn’t, it might result people moving to were things are more affordable.
Windsor has pledged to build 13,000 homes by 2031 with the region needing approximately 30,000 homes as whole to restore affordability. These targets are largely static and don’t take into account local dynamics like needing 1,500 extra homes for battery plant workers or enrollment of international students in a community and their impact on housing demand.
There are already reports that we are lagging behind our targets, but the question is where are the house being built? This is important because their construction local will change traffic, service and other patterns across the region while also likely setting the base price of units.
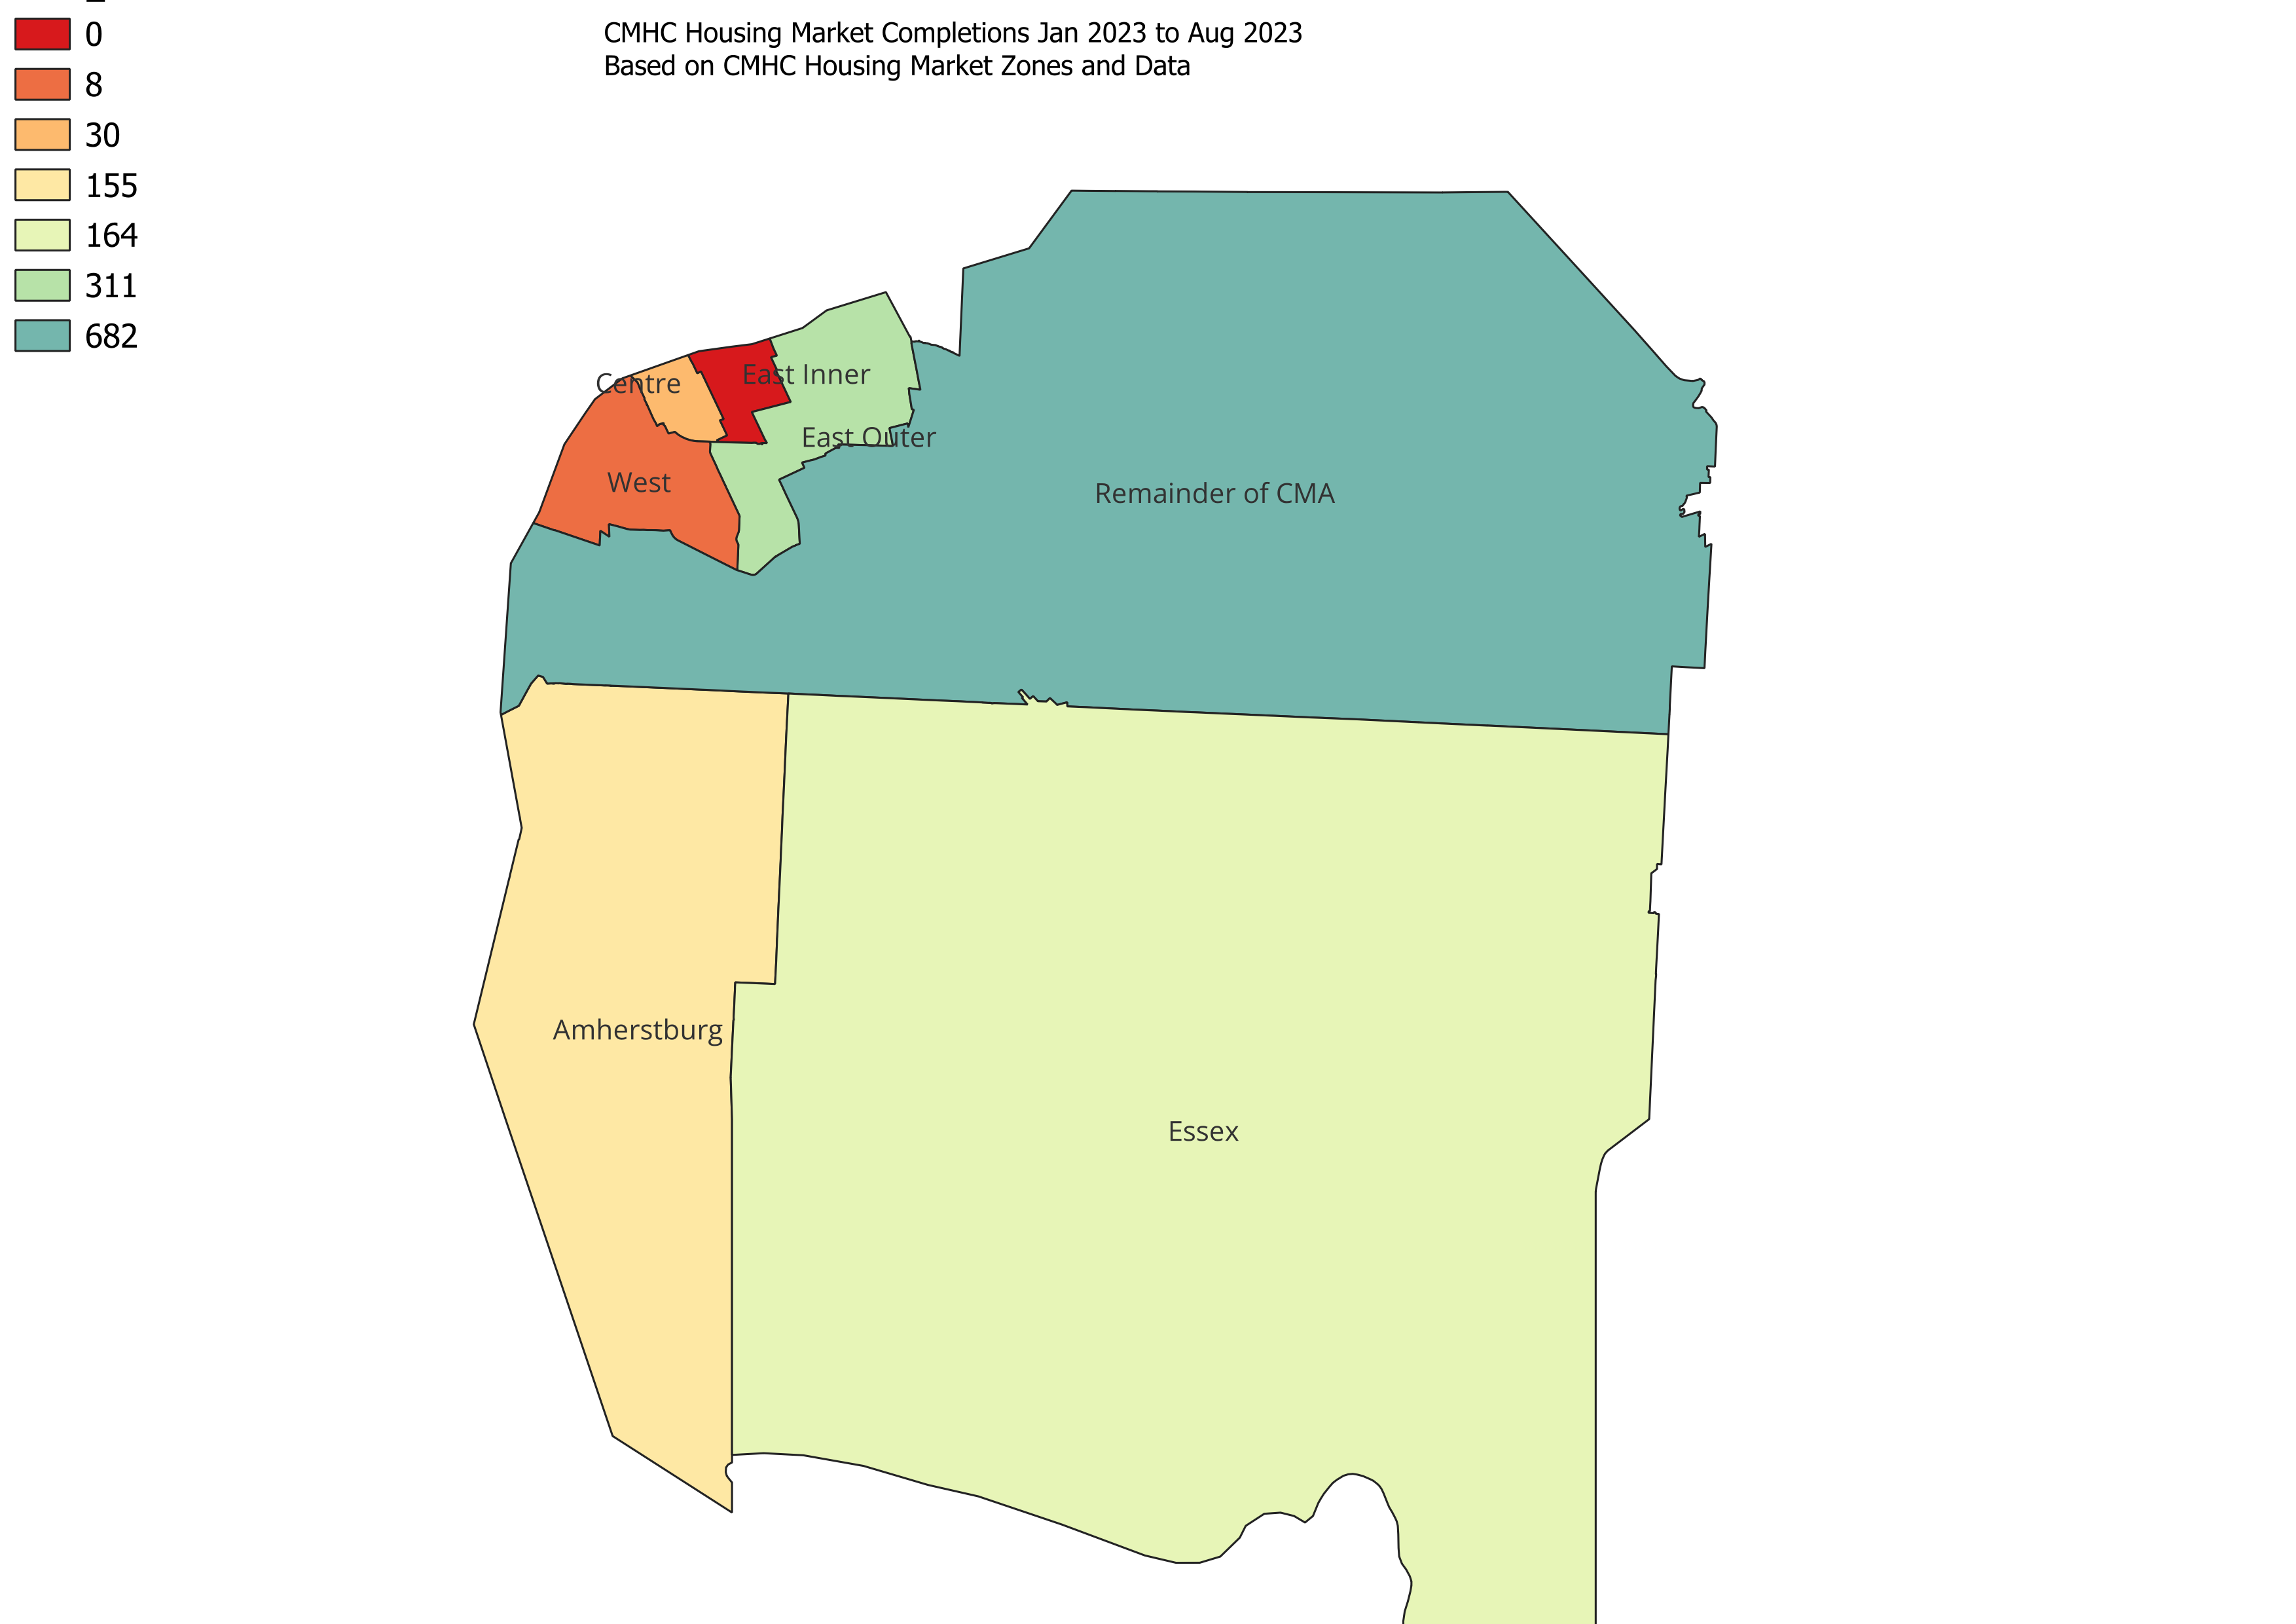
This is the lowest level of geography that is generally available for CMHC that doesn’t require manually coding dozens of lines of data.
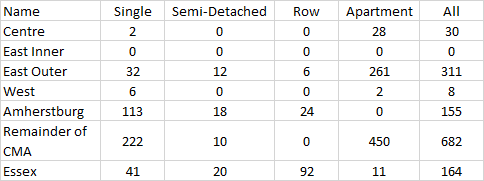
The mapping and the table above show the number of new units completed over the course of 2023 to date. The core of Windsor (Centre – Ward 3 & 4; East Inner Ward 4, 5 part of 6 & 10; and West – Ward 1, 2 and 10) has seen very little development with a total of 38 units coming online while East Outer (Wards 6, 7, 8, 9 and part of 1) has seen over 300 units including significant apartment developments coming online. These number pale to over 1,001 that have gone up in the rest of the Essex County.
To be fair part of this is cyclical where units were approved a months or even years before are now coming online. There are a few important things to takeaway from this year’s housing data.
- Those fighting for a revitalized downtown are facing challenges as units go up much faster out in the county. From an affordability perspective the lack of units going into the Core of Windsor where less affluent household tend to live and find services – this creates intense market pressure in limited geographies.
- Even if these units are selling for less than the median absorption price they are definitely being built in more affluent areas of the region. If the City can’t keep up with construction it risks wealth flight from the community.
- A serious conversation about regional transit probably needs to start – like yesterday.
I am likely going to start a monthly tracking post for housing market data in Windsor. September’s data will be out on October 17th so check back short after then to see where housing is being completed as well as housing starts as a measure of approvals within geographies.
You can subscribe to the blog by providing your email and have each post sent to your inbox.

As you state more builds are happening outside of Windsor’s core areas. Right now Windsor’s core has the highest density in the county. My question is will these new builds be in low or medium density zoned areas. What I’m getting at is there a possibility Windsor’s core neighbourhoods will still have the highest density after new builds come to fruition?
It depends a bit on the built form of those builds but I think what you might see are different hubs of density across the region.
Look at the Banwell plan that was approved today…
https://windsorstar.com/news/local-news/committee-approves-scaled-down-version-of-massive-banwell-road-project
Apartments, row houses, semi-detached and single detached plus some business and community living spaces – pretty mixed use.
Why do you think there is such a lack of development/investment in Windsor’s core? What can be done? And will this change? The downtown and even parts of Tecumseh road have alot of potential to sustain increased density yet we are not building (except for the far east side).
Pingback: Tracking the Housing Crisis in Windsor Essex – Oct. 2023 | gingerpolitics
Pingback: Pinching Pennies: Looking at Financial Strain | gingerpolitics