TLDR – Windsor Essex is no longer one of the top land spots (top 10) for immigrants/non-permanent residents but does receive proportionally larger share than it’s population would expect. A portion of these newcomers are in low income representing about 1/3 of all of low income residents in Essex County – this is a higher proportion of other communities but there is a wide body of research about the medium long term income potential of these groups that would see a high turnover in their groups. Many of the narratives around international students and refugees although are not as impactful as some would have you believe. Meanwhile approximately 2/3s of low income residents who are not newcomers has been a consistent level and concentration across multiple censuses and other data sources like the point in time count of homeless populations. The recent income inequality data a new release of the 2020 Census and updated with 2021 taxfiler data is illustrates the growing two tacks of our economy locally.
So I did some media last week: Monday I was on CBC Windsor Morning talking about the income data in my last blog post. I also did Afternoon Drive on Tuesday talking about this Century 21 Survey and theur impacts on Windsor. I received some feedback on this, and that I didn’t talk about the role of immigration and poverty in our community.
Immigration definitely plays a role in our low income data but is less important the “sticky” non-immigrant poverty in our community nor the growing inequality trends. There are reasons for that which I will outline below.
Immigration
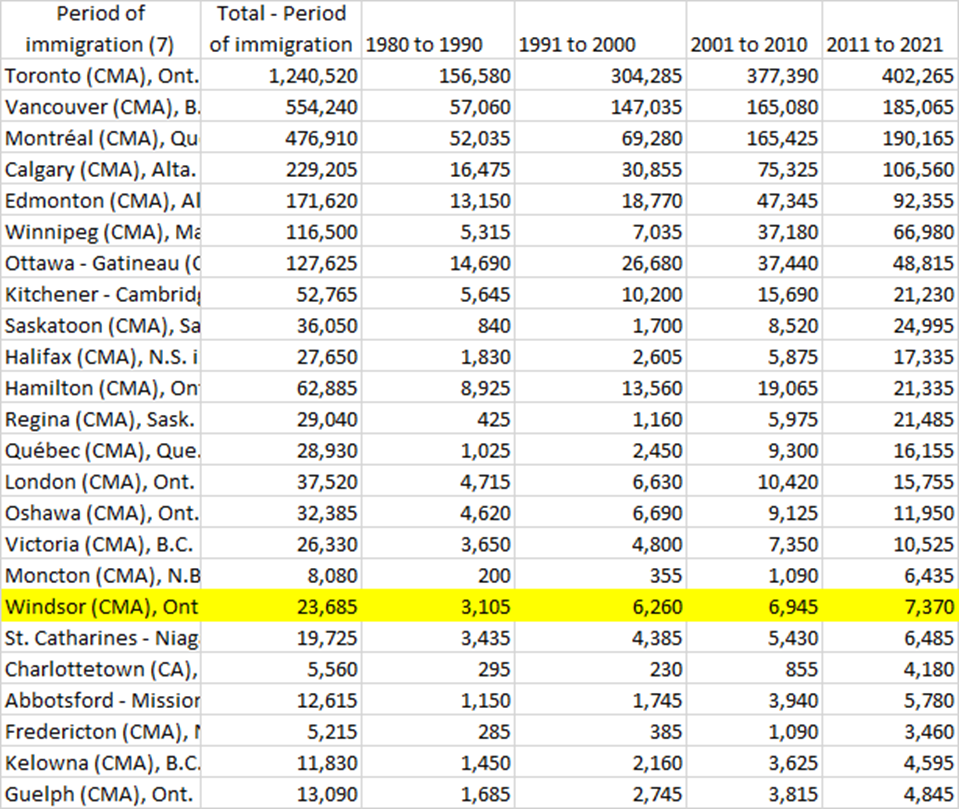
Let’s just frame where Windsor Essex is from an immigration standpoint in Canada. The out of date narrative that we are 4th most, 6th most diverse or welcoming community doesn’t hold up anymore.

Based on the above the Windsor CMA ranks 11th for immigration. This regional data from the Census so it is NOT just the City of Windsor and I will be using regional data throughout the piece as that is more relevant and easier to access in many cases. The table above is sorted by total immigrant population. About 96,000 immigrated to our community which is significant, but not in the top 10. As percentage we do climb into the top 10 but outliers like Abbotsford BC (dealing with spillovers from Vancouver region) jumps over us as well. We fall back a bit further if we include temporary/non-permanent residents which are international students (I’ll get to that in a minute) and temporary foreign workers.
If you are wondering how the City does, it ranks 22nd for total immigrant population (66,610); 41st as a percentage of immigrant population at 29.7%; and 44th at 32.7% when considering immigration and non-permanent residents. We preform poorer because many of the smaller communities that surround the major metro areas have significant spillover effects in their regions.
Has there been lots of immigration since the last census between 2016-2021? Maybe it was a recent spike?

We as a community took the 13th most new immigrants between 2016-2021. But as a percentage of total population we fall to 18th as a number of smaller communities too larger shares of newcomers. I am happy to accept that there may be a some increase since the 2021 Census year (that data will be available soon) but the question that has to be tackled if you are talking increasing poverty levels is how big of proportional increase of low income immigrants is there? A three percent increase from immigration over a 5 year period is not nothing, but it is certainly not overwhelming, given that the average increase of the top 25 cities was 3.87% the Windsor Essex region was actually below average at 3.81%.
Economics
The other misconception that was our region is an economic powerhouse that attracts immigrants. We can certainly quibble about that definition but Windsor region is home to the 17th largest regional economy in Canada.
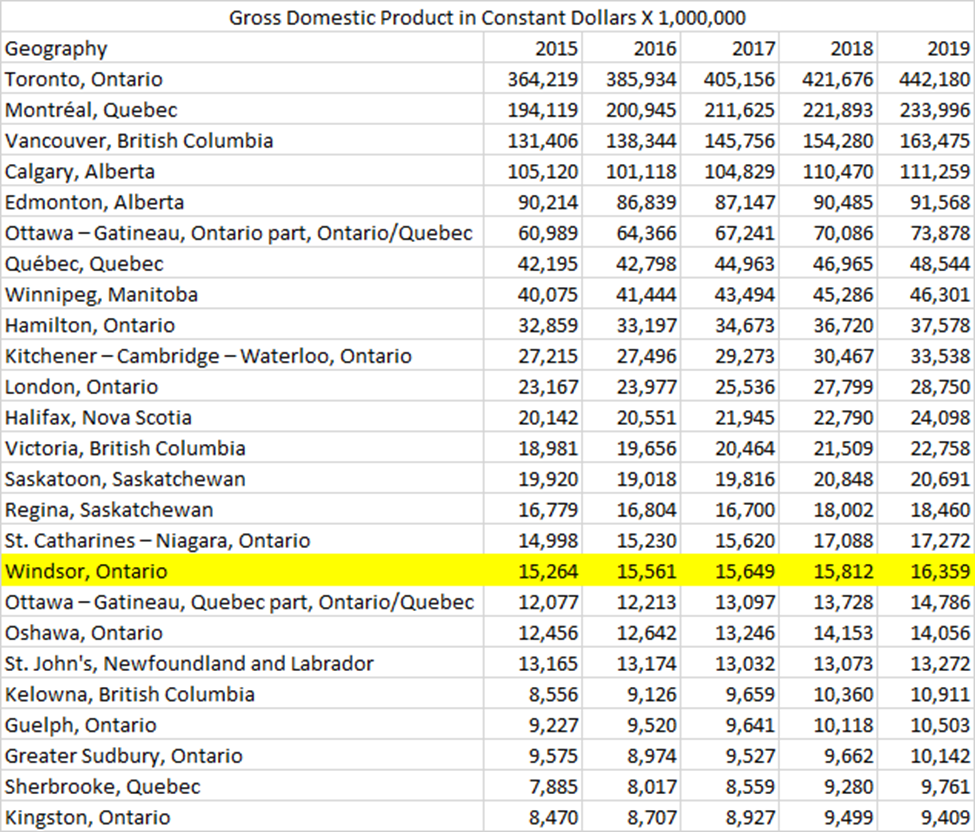
Being the 17th largest economic region is important, but I personally think the comparative affordability makes the region attractive to immigrants. Economic migration is directly linked to the skill demands and income opportunities in our region while for groups like refugees and asylum seekers the Federal Government also plays a role in where they land if they are not community sponsored.
In the years since the Census (2020) and Taxfiler (2021) data, affordability has become the pressing challenge locally. Comparatively we are still affordable but movement within Canada, still places local residents at a disadvantage. The data on wages etc. that I spoke about on Windsor Morning illustrates this, Windsor’s decline was larger to comparator cities, as a region we received more CERB proportionally (this is a video data presentation that uses this data) than other regions during the pandemic and our living wage calculation is up by almost 10% year over year. As our affordability competitive advantage has been shrinking I would argue it is locals who feel that pressure more.
Immigrant Poverty
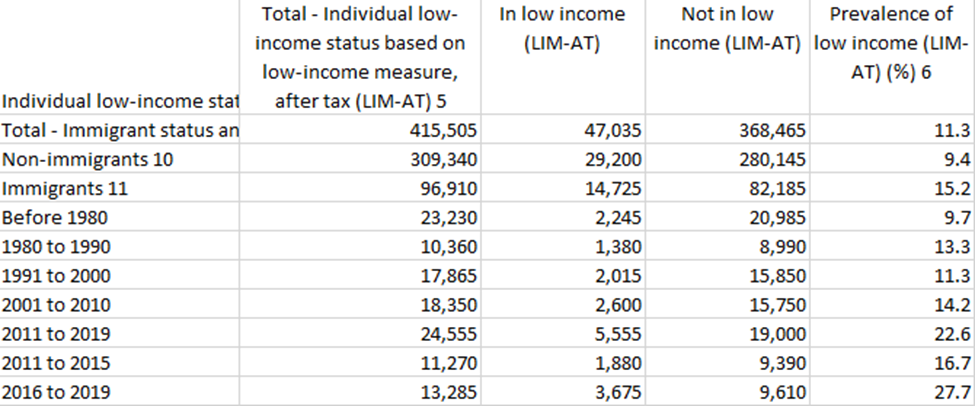
An important question of whether or not newcomers (of all types) are driving higher low income rates for our community was one of the key points of feedback. Below is data from the 2020 Census:
Income statistics are not captured on a rolling basis they are captured on a annually. Unlike the unemployment rate which captured monthly (more on this later) for income stats Statistics Canada roles up annual aggregates then calculates a rate for the year. What that means is a someone who arrives in January takes a few months to find work but then works the rest of year – they can get over that threshold, someone who arrives in November probably won’t.
I am happy to concede nor am I surprised that more recent immigrants have higher rates of low income. It is important to contextualize this by two factors: first, what is the proportion of immigrants vs non-immigrants living in low income and has that number been stable over time. Looking back at the 2016 Census for this data you find 17,000 immigrants in low income and 36,000 non-immigrants. Since this was pre-Canada Child Benefit and some other changes of the federal Liberals which provided support to a wide range of families in low income situations these numbers have declined from a structural sense and were further suppressed by COVID programs like CERB (that our region disproportionately benefited from). That being said the approximately ratio of 2 non-immigrants living in low income for every immigrant remained pretty consistent in the 2020 COVID Census so to simply say that we have lots of immigrants here that is why our poverty is bad is factual not true.
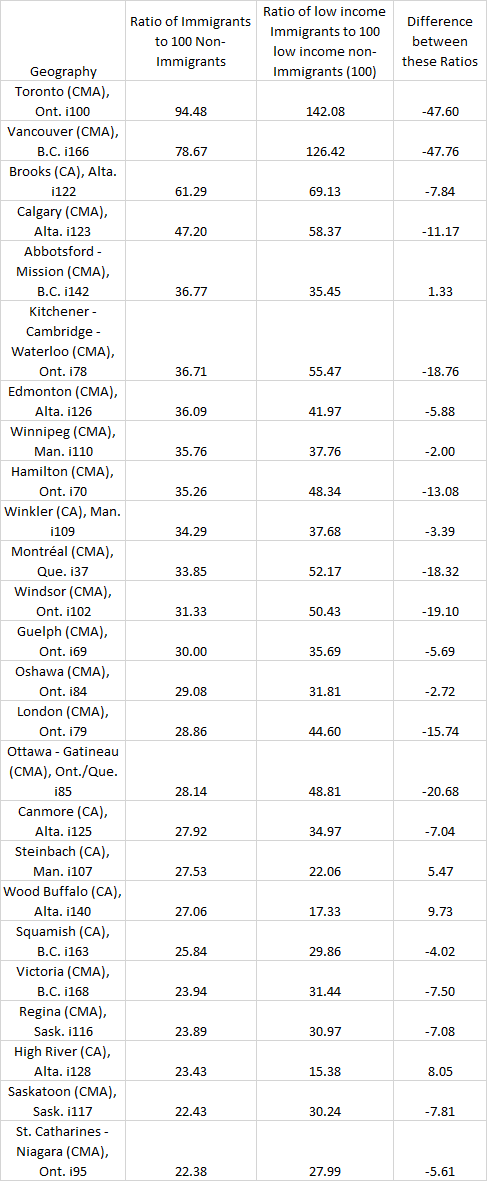
What we find is that in Windsor CMA for approximately 50 low income immigrants, there are 100 low income non-immigrants. This is one of the higher rates of this data ratio in Canada as CMAs across Canada average 15 low income immigrants per 100 low income non-immigrants (calculated out of 152 regional areas). If looking at the same top 25 peers as above we find:

Windsor does have a higher proportion of low income of newcomers for it’s population size but this is where the second factor comes into play. For example Toronto which has almost 150 low income immigrants for every 100 non-immigrants in low income. Comparators like London and Kitchener-Waterloo-Cambridge are all within 5 or so immigrants in the ratio to Windsor, yet they preform better in median income and poverty rates. These communities and their PSE bring in larger international student numbers than Windsor (more on this later) yet it doesn’t impact that low income states?
A portion of this population are indeed refugees (more on this below) but not every refugee arrive in Canada destitute and destined for poverty. Particularly community sponsored refugees often a range of housing, income and other supports. Even the UN highlights (although a few years out of date) that a significant portion of refugees have high skills and start businesses in Canada. In other words they are not all poverty stricken when they arrive. Yes their initial incomes are a bit lower but it doesn’t stay that way.
There is well established literature on newcomer/immigrant/refugee earning potential overtime. This ten year study of immigrant income overtime points to low income being a transitory factor for most newcomers or this study look at refugees from 10 different countries over more than a decade. Both these studies and other academic research point to the fact that over time immigrants or refugees tend to grow (not without barriers and challenges) at a consistent and regular rate. We also see significant earning growth in second generations of immigrants to Canada.
Although not perfectly true for every background and origin, as illustrated by this week’s study on ethnic origins and poverty – the complicated relationship between family/household size, knowledge of English or French, education attainment, economic income and even selected metro area tends to lead to intergenerational movement in households. They find that across 11 racial groups white population tend to be less at risk of poverty while visible minority groups in many cases tend to have higher rates with declines for most over generations. Essex County has approximately 1 in 4 persons who are visible minorities making us the 14th most diverse.

Again the question is, does this proportion in relationship to local poverty result in our higher rates? Again I would argue no, both London and Hamilton are a fraction of a percentage less visible minority populations (despite significantly larger total populations) yet lower poverty rates. KWC is far more diverse and has lower poverty rates and higher income as well.
Even the regional housing Point in Time count data also provides insights of those experience the most significant challenges with poverty. In the 2016 Count only 3% identified as immigrants or refugees this has grown to about 20% of the homeless population in the 2021 count. I wouldn’t call this definitive but it does provide insights into depths of challenges faced by some in our community. Homelessness is often a symptom of many other challenges and it can be used a snapshot of some of the most challenging demographics in a community. The fact that immigrants are represented at a smaller portion of this population in that snapshot illustrates some of the additional supports (formal and informal) they can tap into.
Despite there being poverty amongst newcomers in Windsor-Essex I would argue it is not a significant amount to lead to statistical outliers particularly against peer communities of London and Kitchener-Waterloo regions.
Types of Immigration
We can further refine this poverty discussion as not every person coming to our region has the same circumstances attached to them. Looking at the Windsor-Essex we see the following:
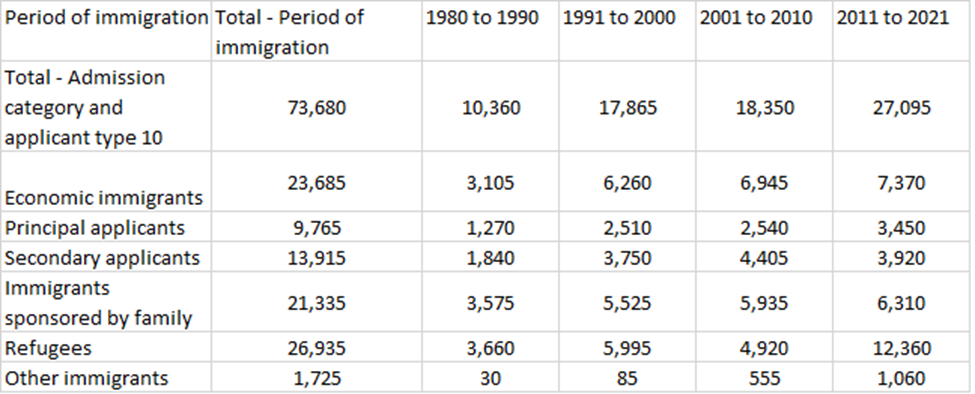
I take away a few thing:
- I would argue we have under preformed from an economic immigrant perspective. Despite the recent reporting of 570ish tech-workers coming to Windsor I would say we might be under preforming particularly when we look at our peer communities.
London and Kitchener Waterloo are attracting 2x or 3x the number economic migrants as Windsor. Part of the weakness of our economy as a whole is the failure to directly attract economic migrants. When these people arrive in Canada they are walking into a job just not here.
2. We have taken a significant share of refugees into Windsor Essex.

London and Kitchener-Waterloo take approximately an equal share, their advantage on our region is that they are larger regions which provides statistical noise while also attracting large shares of economic and other migrants that we aren’t doing. Certainly refugees arrive with challenges but proportionally the numbers are large enough to skew our regional poverty or income data IMO particularly when you consider the numbers brought in by other communities.
I am not breaking down the other categories but principle and secondary applicants both require significant financial, educational and language based criteria to be admitted to Canada’s point system, while family sponsorship requires that the family to be able to support the new immigrant.
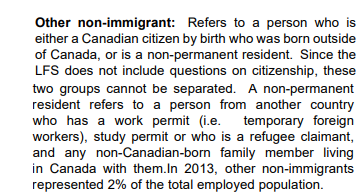
Then there are the non-permanent residents which are not counted as immigrants until they are permanently allowed to stay in Canada.
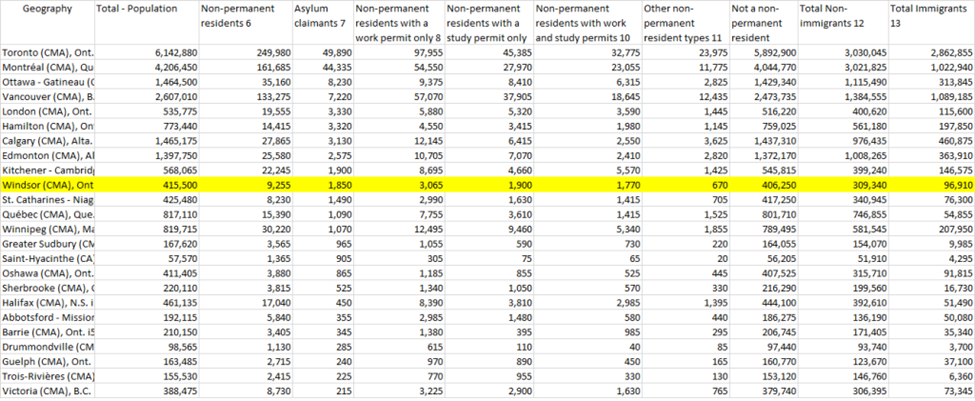
The table above is sorted by Asylum claimants where again we find ourselves below major SWO peers. That the fact London and KWC have 2-2.5X the number of non permanent residence again points to the illogic of the “immigrants drive poverty narrative”. Are some of them struggling, absolutely but not enough to skew region wide poverty data outside the margin of error in my opinion.
International Students
What about international students coming into the community via St Clair College and the University of Windsor. Let’s dig into these number a bit shall we? This website has the Ontario Public Service Open data where we can find enrollment headcount data for PSE institutions across Ontario. You can find the university data available to download here and the college data available here.
When you look at enrollment data that is submitted to the province you see this:
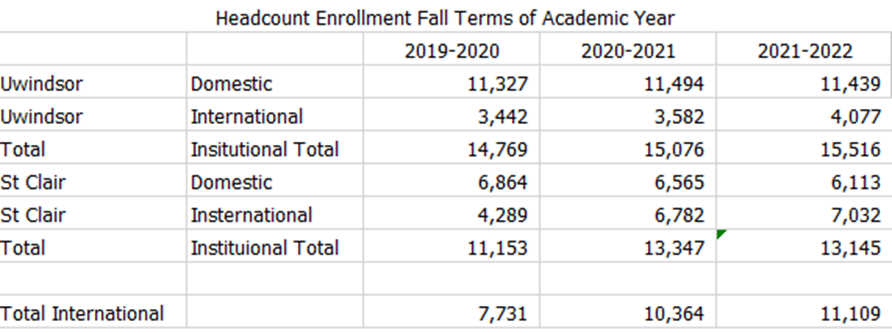
It is more complicated then the totals that are reported. That is because in Sept 2021 the same year as this data, St Clair College announced that over 3,000 of their international students would be going to the Toronto Satellite Campus. These students are NOT enrolled in at the Windsor Campus but they are St Clair College students and captured in the headcounts above and if you look in the open data the campus specific enrollment, you see the Toronto Campuses having approximately 3,000 student enrolled. It is unlike these students will ever step foot in Windsor or if they would come here they would not be captured in the data that was discussing.
I have heard the value that 15,000 Indian students have come to the community/region. To the nationality of the students enrolled locally, it can also be found in the same open datasets, as the headcounts. St Clair College had 6,059 students in 2021 and the University of Windsor had 2,464 students from India. It is possible that it didn’t mean in 1 year, looking at this Indian student population over the last 3 years we see this.
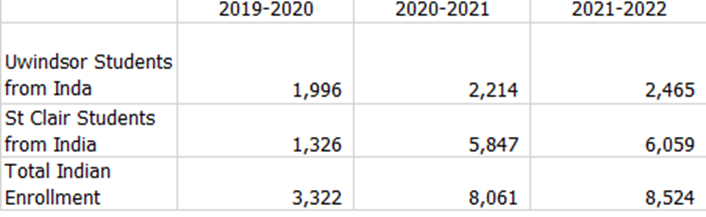
You can certainly see the growth, but you also have to remove approximately 600 in 2019, 2,000 in 2020 and just under 2,200 in 2021 students which based on St Clair’s enrollment data, I would estimate they would be Indian and they would be in Toronto. In other words, the number of students and international students as a whole, is certainly growing rapidly, some might call irresponsibly, but we aren’t seeing 15,000 students from India enrolled and on campus locally in a single year based on the data. If its multiple years we are talk about, then you can’t double count as many programs are two years or more and the same student is being counted in head counts.
Now we have certainly have heard stories about international students facing significant financial challenges coming to Canada and our community. They are required to show proof of funds to get their student visa (for Windsor student visas numbers see tables above) and although that does not guarantee not being captured in low income data, the numbers outlined above do not correlate 1 to 1 with poverty. Beyond this as poverty is calculated at household in taxfilers and many students are living with roommates are considered non-census family households – thus changing individual threshold a person in a household would have to clear to not be in low income. Whole debate can be had of whether this is fair or representative or not – but we aren’t doing that here. If they exceed the threshold they are not in poverty despite conditions that say otherwise.
It is possible that the number spiked in the 2022-23 year but overall both University and the College are not the largest post-secondary institutions who bring in international students in the province. Looking through comparator schools in SWO London, Kitchener-Waterloo region both have larger international students populations yet lower low income rates and higher median incomes. So again placing the blame there doesn’t make sense. Both the College and University absolutely have to do better as they haven’t built enough residents and students do struggle in our community but I would argue they not a driving factor in our region’s continued struggles or the statistical levels of poverty and income that we see.
Unemployment
Do newcomers and international students skew unemployment that data locally? I have problems with the labour force survey – I have called it a random number generator many times on this blog – one thing it does consistently is not capture students in school as part of unemployment data.
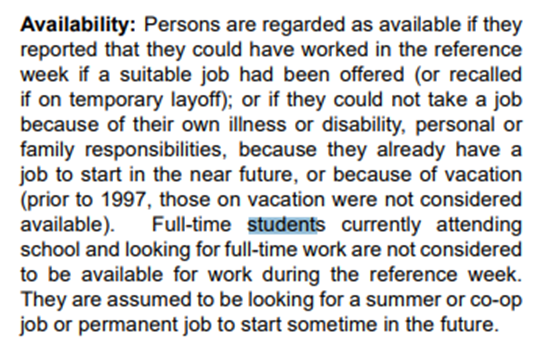
For all of the full-time students listed above who are in Windsor and then get a call by Statistics Canada, they would not be captured in the unemployment data in our region. if they are working it is considered secondary to their studies and capture outside the main unemployment rate. This does not mean that students are not working or struggling to make a living but they aren’t be captured in the unemployment rate. There are also challenges with capturing refugees and the immigrant extended family members in the Labour Force Survey Data data:

In other words, there is no way to tell what the refugee claimant, unemployment rate is. But according to Statistics Canada this is a smaller portion of the population that would be lost in the margins of error of the labour force survey.
Let be frank many newcomers don’t immediate look for work as they are learning language skills or are transitioning their families to a new country, if they were called by the Labour Force Survey, they would be screened out as not looking for work and captured in the participation data. We haven’t even raised complex social issue of gender roles for some newcomers households where women working isn’t always an option. To give us an idea we can use provincial level data to get a snapshot of what immigrant unemployment rates look like:
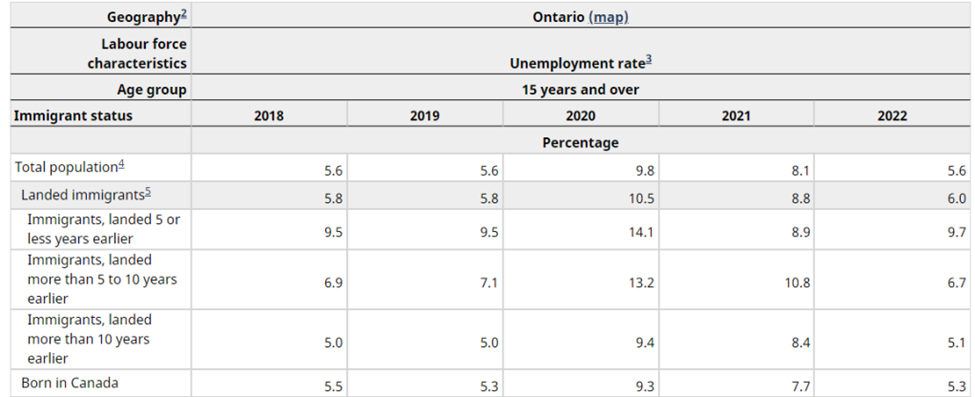
You can see the annual average unemployment rate by immigration grouped by time in Ontario. You will note that recent immigrant unemployment rate in Ontario is about 4% higher than the total population if we compare to some recent data for Windsor.

You would expect a new immigrant unemployment rate around 10%, not exactly an outlier compared to the provincial scale rates. Given this is one of the best unemployment rates in our region in a long time that’s our unemployment isn’t bad even when considering
The more worrying statistics is the Participation Rate. Windsor for the past decade has had lower participations rate with 2-3% of our population more or less just opting out of trying to find work. For some that is a choice, a parent staying home with their child, for many newcomers it learning the language or upskilling and not immediately looking for work. It is possible that this rate is slightly lower due to our newcomer population
Workforce Windsor Essex did a whole study on this that provides a wide range potential opportunities and actions that it isn’t clear if they are being implemented. Despite our region have lower participation rates, lower employment rates and a fluctuating unemployment partially due to the approximate 4+% margin of error for data in our region. Again there is little surprise in this as of course you would expect newcomers over time to find employment and earn higher incomes – lifting themselves and their families (if applicable) out of poverty. The classic Canadian dream story but for many newcomers they aren’t even captured in the data so how can they be skewing it?
Income Inequality
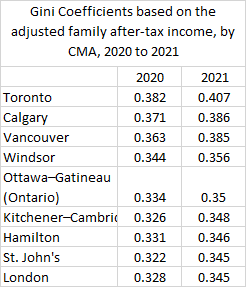
This brings me to the income inequality part of the conversation. The Windsor region have the 4th highest income inequality in Canada. To be clear on a few points, income inequality in Canada isn’t as bad as in the US or a number of other countries. Canada’s social safety net, although flawed, and income transfers like OAS, CCB, GST/HST make significant impacts for lower income households. Many of these can be accessed as soon as someone is a permanent resident and files proper paperwork and/or income taxes.
Yet for the last 20 years Income Inequality has been getting worse. When you really dig into the number you actually see that cities preform better than rural areas due to their be more economic opportunity. Looking at the top 10 cities in Canada as represented by their gini-coefficient you see:
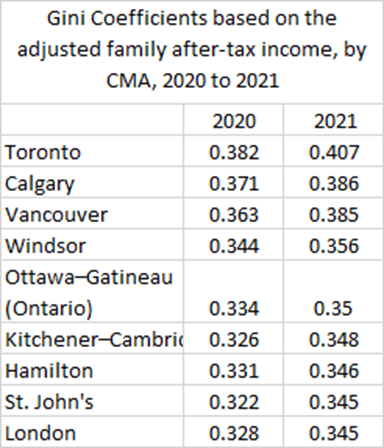
Unlike almost every other data we looked at Windsor does rank poorer than our peer cities from an income inequality perspective. Now poverty does not equate to income equality. Income inequality is the distribution of wealth across a geographic region. Having more lower income people does not mean you are cursed with higher income inequality it depends what the whole spectrum looks like. Generally the higher the gini-cofficient score regardless of what is happening at the two polar extreme of the spectrum the middle class is shrinking proportionally, that is what is important to think about.
The Bank of Canada report from above cited above when the looked at the immigration trends and their impact on income inequality they found:

As I illustrate in the sections above I don’t think newcomers just arriving to Windsor is a driver of our challenges. What seems more likely is that are highlighted in the same Bank of Canada Report is that – globalization (out sourcing of jobs and downward income pressure), automation and increase technological usage, higher education requirements all have bigger impacts on income inequality than immigration. All three of those other trends have disproportionate impacts on Windsor-Essex as Mike Moffat talked about here and I talked about with local educational attainment data and gap.
More recent aggregate wealth data from Q4 2022 for Canada points to increasing income divides as the affordability crisis begins to set in, in the annualized datasets. This hints that these trends will get worse, what I am watching is does it get disproportionally worse for our community.
Conclusions
The argument that because our community/region takes a percentage point or two more immigration (to our peers) is the root cause for lower incomes, higher unemployment rates and growing income inequality is fundamentally flawed. Does it play a role, yes, but I would argue not proportionally more so than any other community in SWO. Not only does this ignore everything outlined above for a over simplistic analysis but also the fact that about 2/3s of low income people in Windsor-Essex are Canadian born.
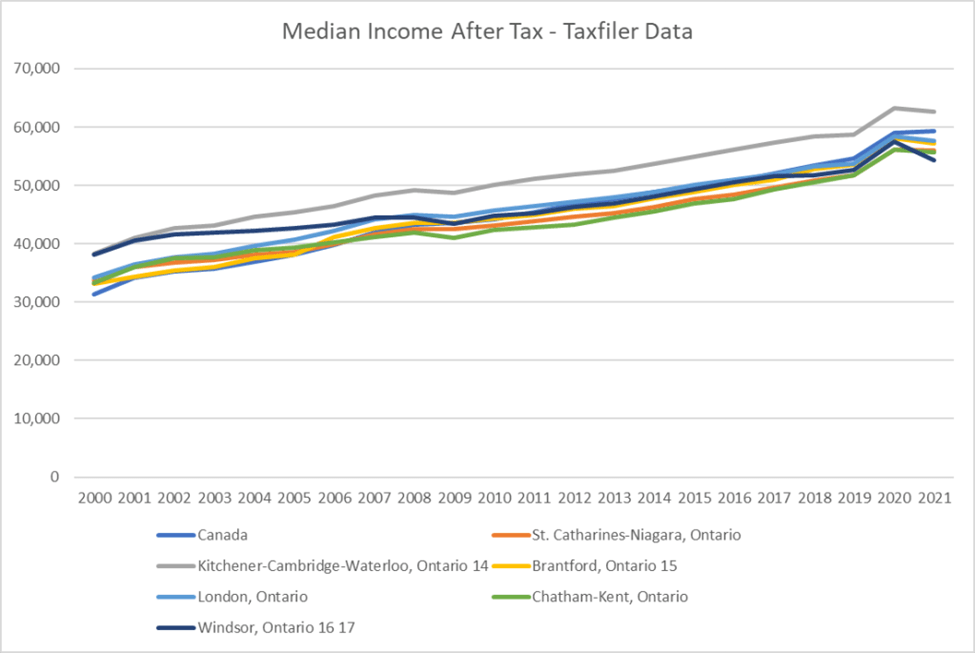
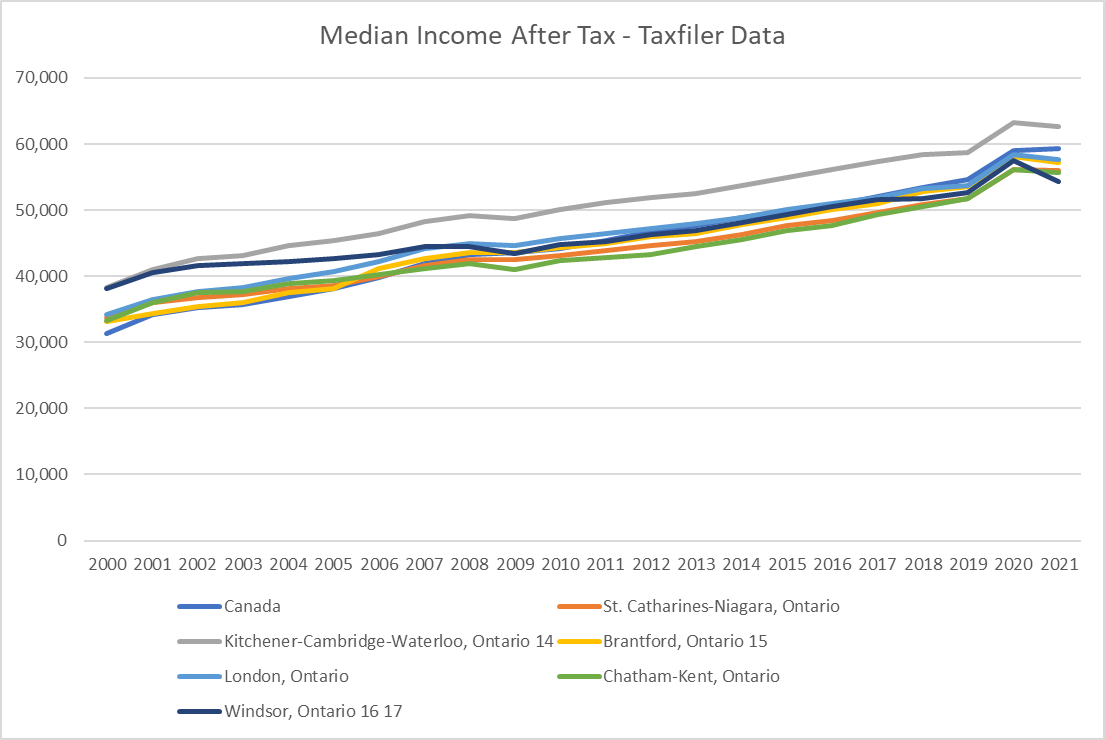
It also ignores that in generation (from the year 2000) we went from a region with incomes greater than the national median and thousands of dollars per year ahead of our peer communities in SWO to a laagered who now ranks near the bottom and receives disproportionally larger income supports from government transfers.
The median two person income household in Essex County based on the most recent tax data has a median income of $93,000 before taxes, $82,000 – lets assume they have been saving 10% of their take home for the last 5 years – $41,000 for a down payment. According to CIBC they could afford a max purchase price of $328,000 assuming 0 other debts. The average home price is over $500,000 in June of this year. The issue isn’t immigrants are poor and skewing our data, it is that we are actually poor. We had been protected by low interest rates and demand in our community, but this gone and is never going to come back. A couple from London making that median income ($103k BT $96k AT) can afford an extra an extra $38,000 on a home that a Windsorite can’t.
This story is the fundamental challenge that we don’t want to talk about in Windsor Essex. In 2000 we were statistically one of the most attractive communities for newcomers. The sunny days and glory days narratives that are perpetuated today took root then, but you only need to look downtown to realize that this narrative is flawed. We have hitched our future narrative to electrification of cars but that narrative ignores the fact that thousands of auto jobs are going to be shed through this process and that battery plant wages are a fraction of traditional auto jobs. That pressure is going to push its way through the supply chain disrupting every tool shop and supplier in my opinion.
If we are unwilling to talk about the root symptoms of the challenges we face. When we celebrate Amazon Delivery centre jobs or how we didn’t plan ahead for housing when attracting a major investment as being a win for our community shows a disconnect in aspiration and opportunity that is a significant risk for our region.
This post also hasn’t tackled a number of other potential causal factors like: we have continued to struggle to retain youth and more broader outward migration patterns; dug into newcomer education levels and how in many cases they help raise our local data; growing reliance on temporary foreign workers in our economy; housing and rental affordability and demand side pressures on incomes and the transitional economic growth that our region still grapples with.
You can’t “solve” poverty – there will always be someone in a transition phase when their income falls below a magic line – but I would argue Windsor-Essex challenges are deeper than that. To simply say we take a few % more immigrants in a year and that is a cause of the challenges is actually making the macro conversations about our community that much harder to have.

Pingback: Pinching Pennies: Looking at Financial Strain | gingerpolitics