A post with a bit more research than usual….
- In case you missed it, and want my opinion on school board accommodation review from Monday you can see it here.
- Keep an eye out for the next Mean, Median and Moose Podcast where we rank various rankings that get covered in the media. While you wait listen to last months podcast here.
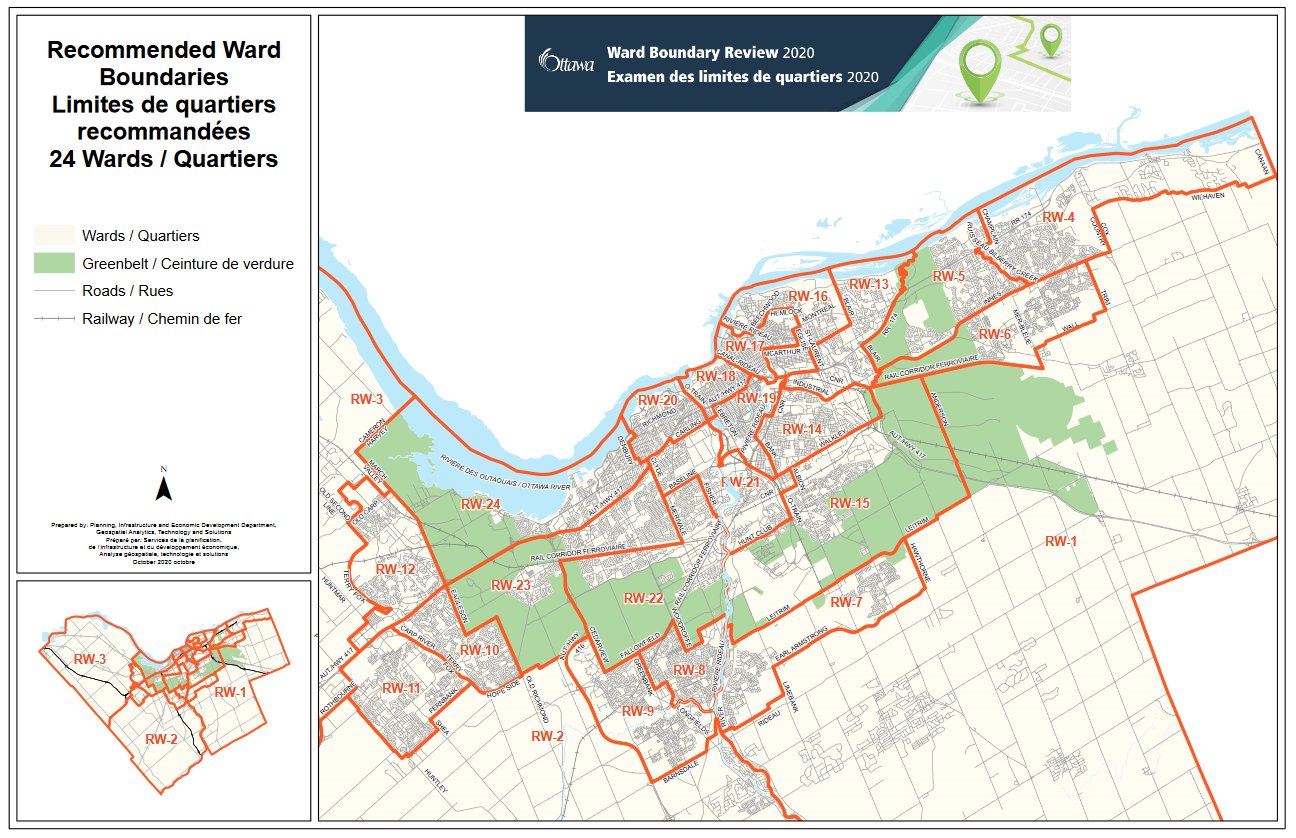
- The city of Ottawa just redistricted their ward system following a review that is going to their council. Depending on how certain wards fall “culturally” you have by my count between 10-12 urban wards, 7-9 suburban wards and 3 ex-urban/rural wards.
- This change was driven by a massive expansion of the City’s urban boundary. More or less Wards 1-3 being newly annexed lands. By 2045, 51 per cent of the new households will be built in existing urban areas, with the intensification target rising to 60 per cent by 2046. The remaining 49 per cent of the growth will be within the expanded boundary.
- In other words, 1/2 of the growth of will be “sprawl”.
- Somewhat in contrast to Calgary decision from earlier this month although they did approve 14 new neighbourhood developments in 2018.
- This change was driven by a massive expansion of the City’s urban boundary. More or less Wards 1-3 being newly annexed lands. By 2045, 51 per cent of the new households will be built in existing urban areas, with the intensification target rising to 60 per cent by 2046. The remaining 49 per cent of the growth will be within the expanded boundary.
- Speaking of suburbia, Bloomberg did a story on a formal effort to classify suburban in the US using machine-learning and a survey of over 55,000 households. The academic working paper is here.
- A very interesting research project from Jesse Helmer – who is also London’s Deputy Mayor and a PhD Candidate.
- Some discussion about “right sizing” remote employee pay for remote workers who moved away from offices so save on housing etc.
- The work of the Opportunity Institute out of Harvard is really cool, and their work utilizing real time economic data and neighbourhood mapping is groundbreaking. How they are looking at long term trends of economic opportunity in the US is conversation changing.
It is the idea that no matter where you start in life, you have a chance of climbing up the income ladder and becoming successful. The American Dream is what draws immigrants like myself to this country. My parents grew up in low-income families in India. Moving to America transformed their lives and, through my personal experience, I have seen how the benefits of their move have cascaded through the generations in our family.
One of the surprising findings from this work was that Charlotte had the lowest rate of upward mobility of the largest 50 metropolitan areas in the country. We were inspired by Charlotte’s response to those findings. Instead of being discouraged by or seeking to challenge the data, local leaders and community members used 50 out of 50 as a call to action, an impetus for convening difficult conversations and beginning the hard work necessary to build a community where opportunity exists for everyone.
Charlotte’s response reinforced our belief that data and research have the power to create real change. We have been pleased to partner with Foundation For The Carolinas, Leading on Opportunity, and a range of local organizations and individuals on the Charlotte Opportunity Initiative to identify policy areas with the potential to increase upward mobility in Charlotte.
- Their first year of research from Charlotte on interventions and programs to shift neighbourhood circumstance is out and the results are certainly interesting.
- This is an interesting essay from Sean Speer and Graeme Moffat on the Case for Conservative Futurism.
- Germany puts in place a 30% requirement for women representation on corporate boards.
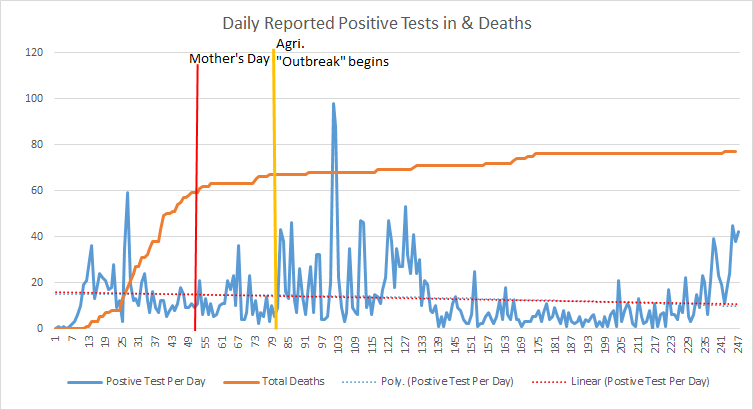
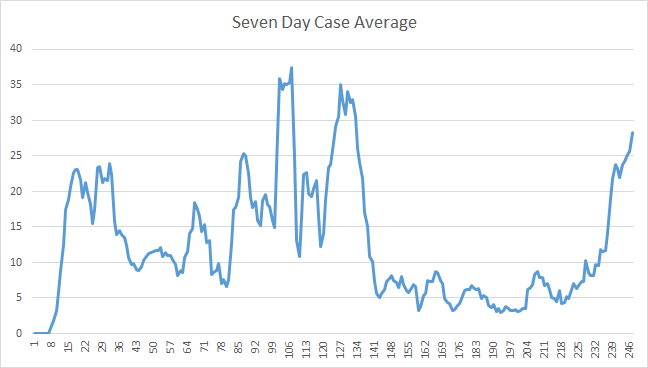
The 7 day average is a far smoother graph to look at than the daily date. The trends aren’t good so be like Izzy!

